Mozambique
| Government | |
| Name | Republic of Mozambique |
| Portuguese | República de Moçambique |
| Government type | presidential republic |
| Capital | Maputo (1,080,277 (2017)) |
| Currency | Mozambican metical (MZN) |
| Organization | |
| Member State | Commonwealth of Nations |
| People | |
| Population (2020) | 31,255,435 (48th) |
| Density of population | 28.7 P/km2 (178th) |
| Nationality | Mozambican |
| Official languages | |
| Portuguese | |
| Ethnic groups (2017) | |
| African | 99% |
| Mestizo | 0.8% |
| Other | 0.2% |
| Religions (2017) | |
| Roman Catholic | 27.2% |
| Muslim | 18.9% |
| Zionist Christian | 15.6% |
| Evangelical / Pentecostal | 15.3% |
| Anglican | 1.7% |
| Other | 4.8% |
| None | 13.9% |
| Unspecified | 2.5% |
| Life expectancy (2020) | |
| Male | 54.4 years |
| Female | 57.4 years |
| Total population | 55.9 years (222nd) |
| Homicides | |
| Total (2011) | 3.5 per 100,000 people (77th) |
| Geography | |
| Land area | 786,380 km2 |
| water area | 13,000 km2 |
| total area | 799,380 km2 (36th) |
| Mean elevation | 345 m |
| Lowest point | |
| Indian Ocea | 0 m |
| Highest point | |
| Monte Binga | 2,436 m |
| Land use (2011) | |
| Agricultural land | 56.3% |
| Arable land | 6.4% |
| Permanent crops | 0.3% |
| Permanent pasture | 49.6% |
| Forest | 43.7% |
| Other | 0% |
| Urbanization | |
| Urban population (2020) | 37.1% |
| Rate of urbanization | 4.35% annual rate of change (2015 – 2020) |
| Economy | |
| Labor force (2017) | 12.9 million (45th) |
| Labor force by occupation (2015) | |
| Agriculture | 74.4% |
| Industry | 3.9% |
| Services | 21.7% |
| Unemployment rate (2017) | 24.5% (196th) |
| GDP (PPP) (estimate 2019) | |
| Total | $41.473 billion |
| Per capita | $1,331 |
| GDP (nominal) (estimate 2019) | |
| Total | $15.372 billion |
| Per capita | $493 |
| GDP by sector (estimate 2017) | |
| Agriculture | 23.9% |
| Industry | 19.3% |
| Services | 56.8% |
| Exports (2017) | $4.725 billion (110th) |
| Exports partners (2017) | |
| India | 28.1% |
| Netherlands | 24.4% |
| South Africa | 16.7% |
| Imports (2017) | $5.223 billion (124th) |
| Imports partners (2017) | |
| South Africa | 36.8% |
| China | 7% |
| UAE | 6.8% |
| India | 6.2% |
| Portugal | 4.4% |
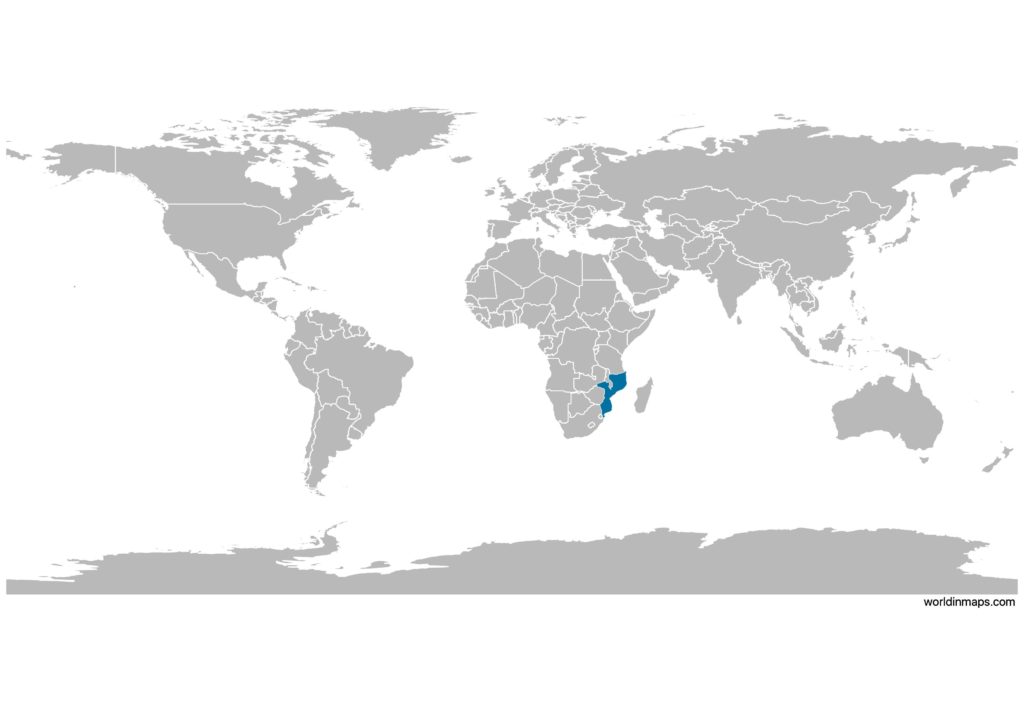
Mozambique on the world map
Mozambique top 10 largest cities (2017)
- Maputo (1,080,277)
- Matola (1,032,197)
- Nampula (663,212)
- Beira (592,090)
- Chimoio (363,336)
- Tete (307,338)
- Quelimane (246,915)
- Lichinga (242,204)
- Mocuba (240,000)
- Nacala (225,034)
Demography
Population pyramid
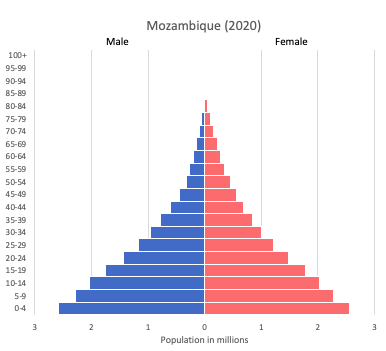
Age structure data
Estimate for 2020:
- 0-14 years: 45.57% (male 6,950,800/female 6,766,373)
- 15-24 years: 19.91% (male 2,997,529/female 2,994,927)
- 25-54 years: 28.28% (male 3,949,085/female 4,564,031)
- 55-64 years: 3.31% (male 485,454/female 509,430)
- 65 years and over: 2.93% (male 430,797/female 449,771)
Remark: the age structure of a population affects a nation’s key socioeconomic issues. Countries with young populations (high percentage under age 15) need to invest more in schools, while countries with older populations (high percentage ages 65 and over) need to invest more in the health sector. The age structure can also be used to help predict potential political issues. For example, the rapid growth of a young adult population unable to find employment can lead to unrest.
Population from 1950 to 2020
Source: United Nations, Department of Economic and Social Affairs, Population Division (2019). World Population Prospects 2019, Online Edition. Rev. 1.
Evolution of the life expectancy from 1960 to 2018
Source: World Development Indicators, The World Bank
Major rivers
Economy
Agriculture:
cotton, cashew nuts, sugarcane, tea, cassava (manioc, tapioca), corn, coconuts, sisal, citrus and tropical fruits, potatoes, sunflowers, beef, poultry
Industries:
aluminum, petroleum products, chemicals (fertilizer, soap, paints), textiles, cement, glass, asbestos, tobacco, food, beverages
Exports – commodities:
aluminum, prawns, cashews, cotton, sugar, citrus, timber, bulk electricity
Imports – commodities:
machinery and equipment, vehicles, fuel, chemicals, metal products, foodstuffs, textiles
Time zone and current time in Mozambique
Go to our interactive map to get the current time in Mozambique