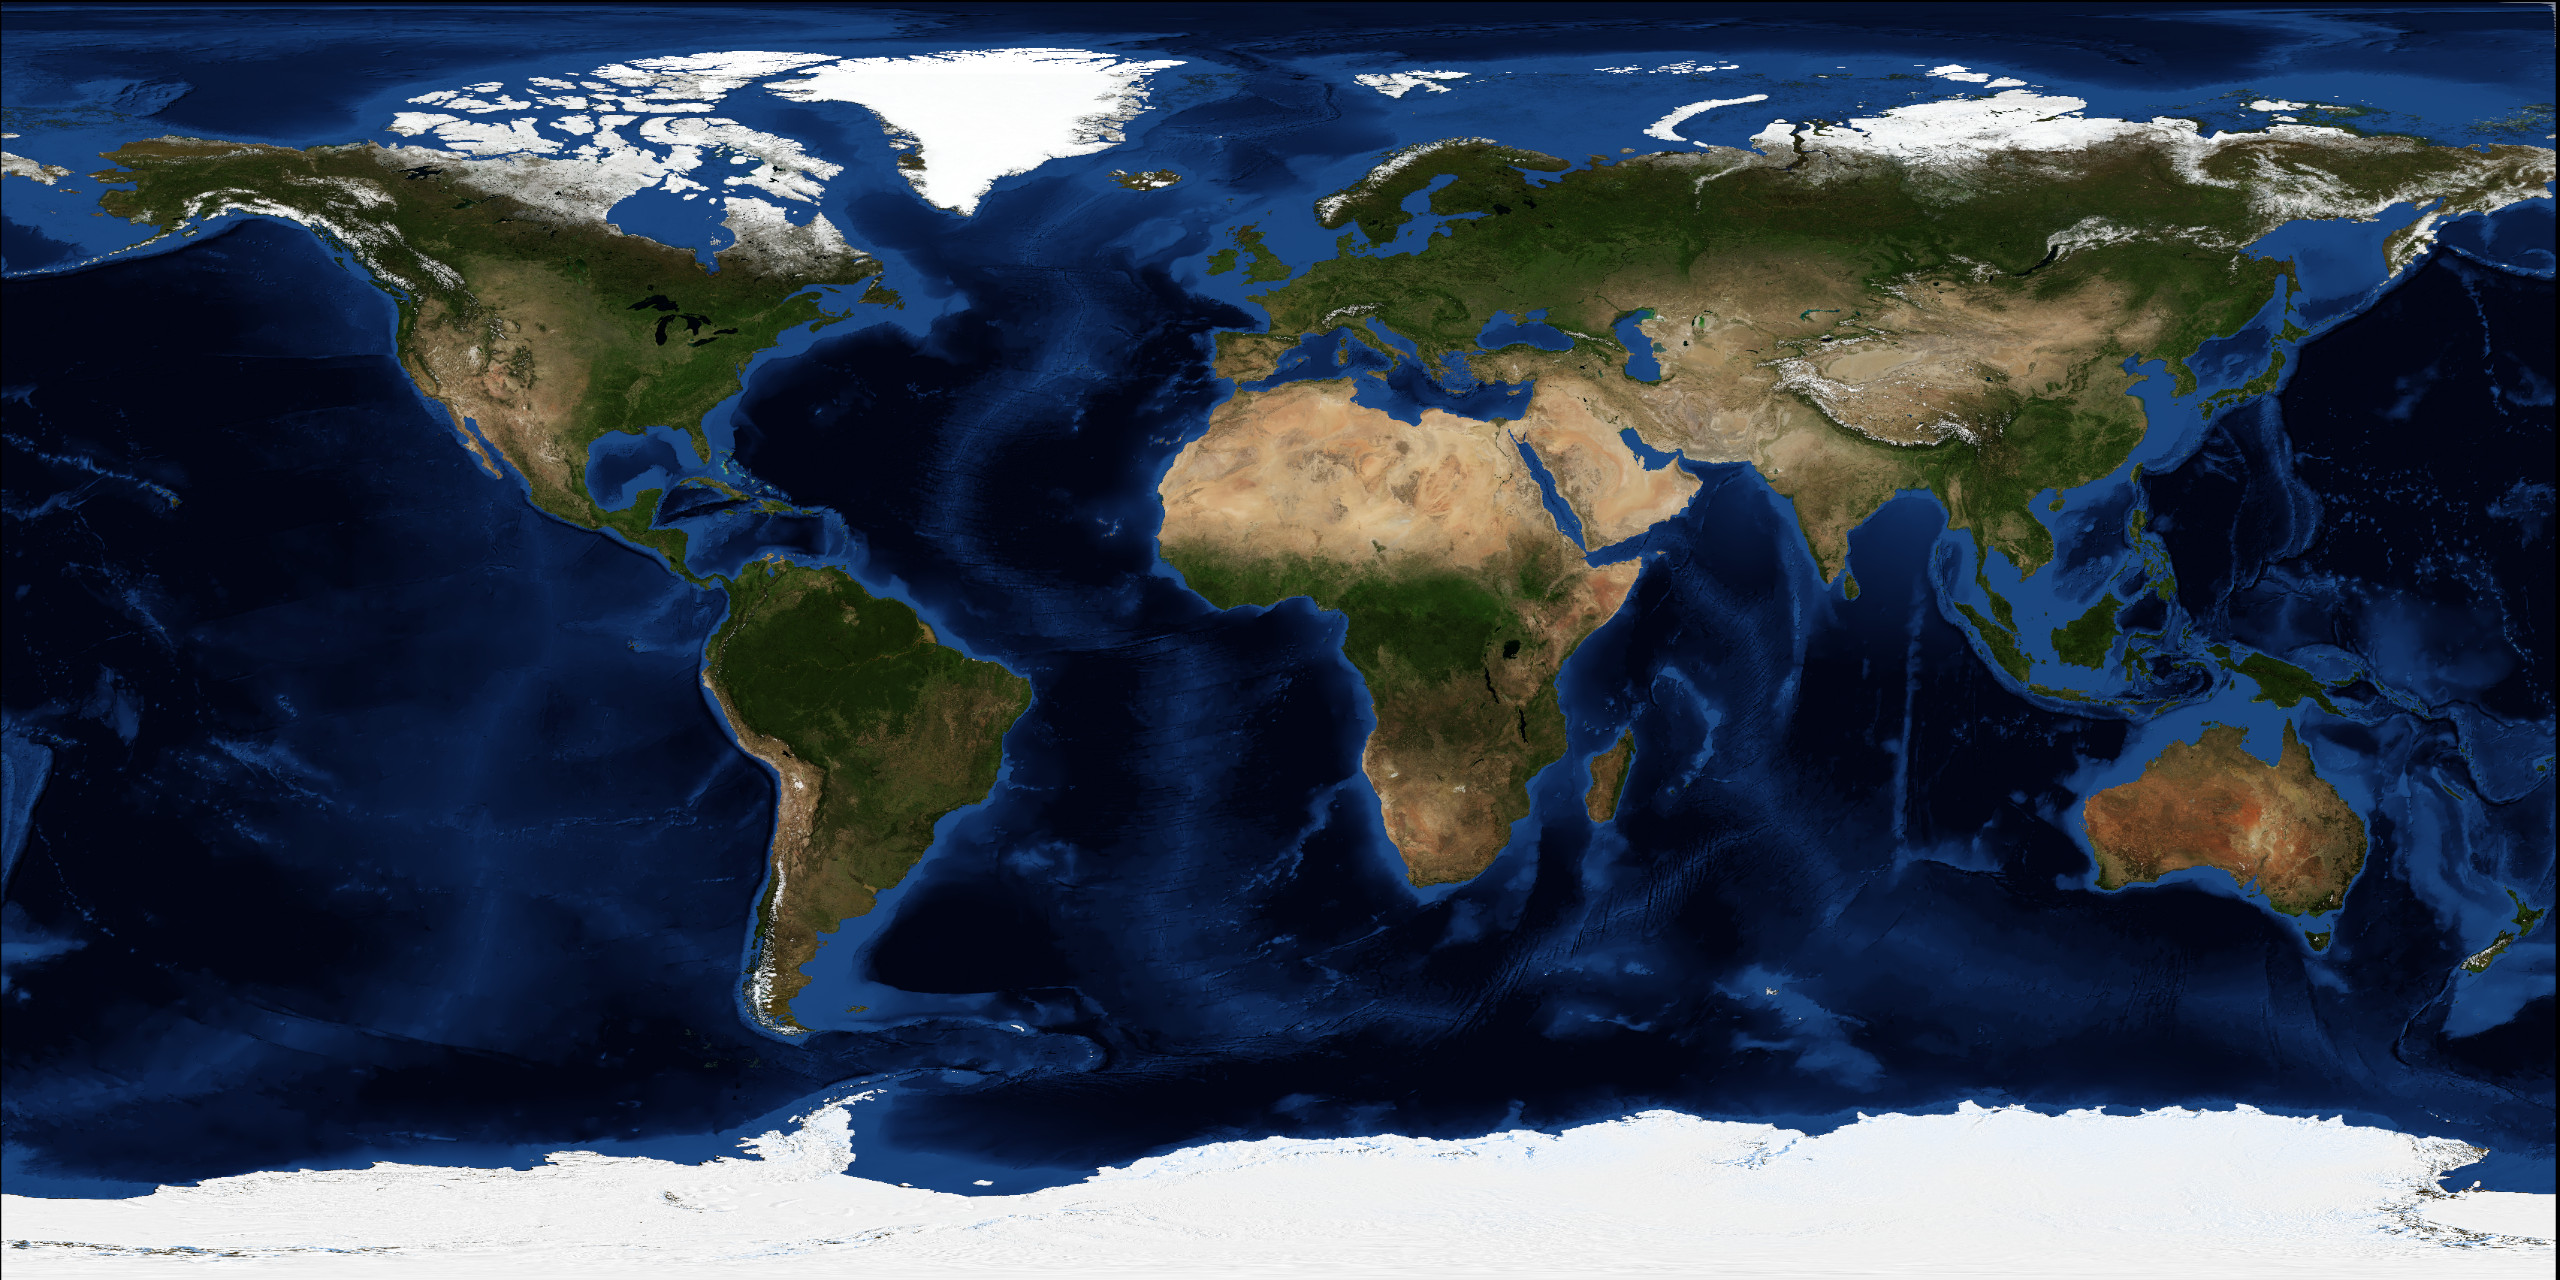
Continents / Europe / Climate
Climate of Europe
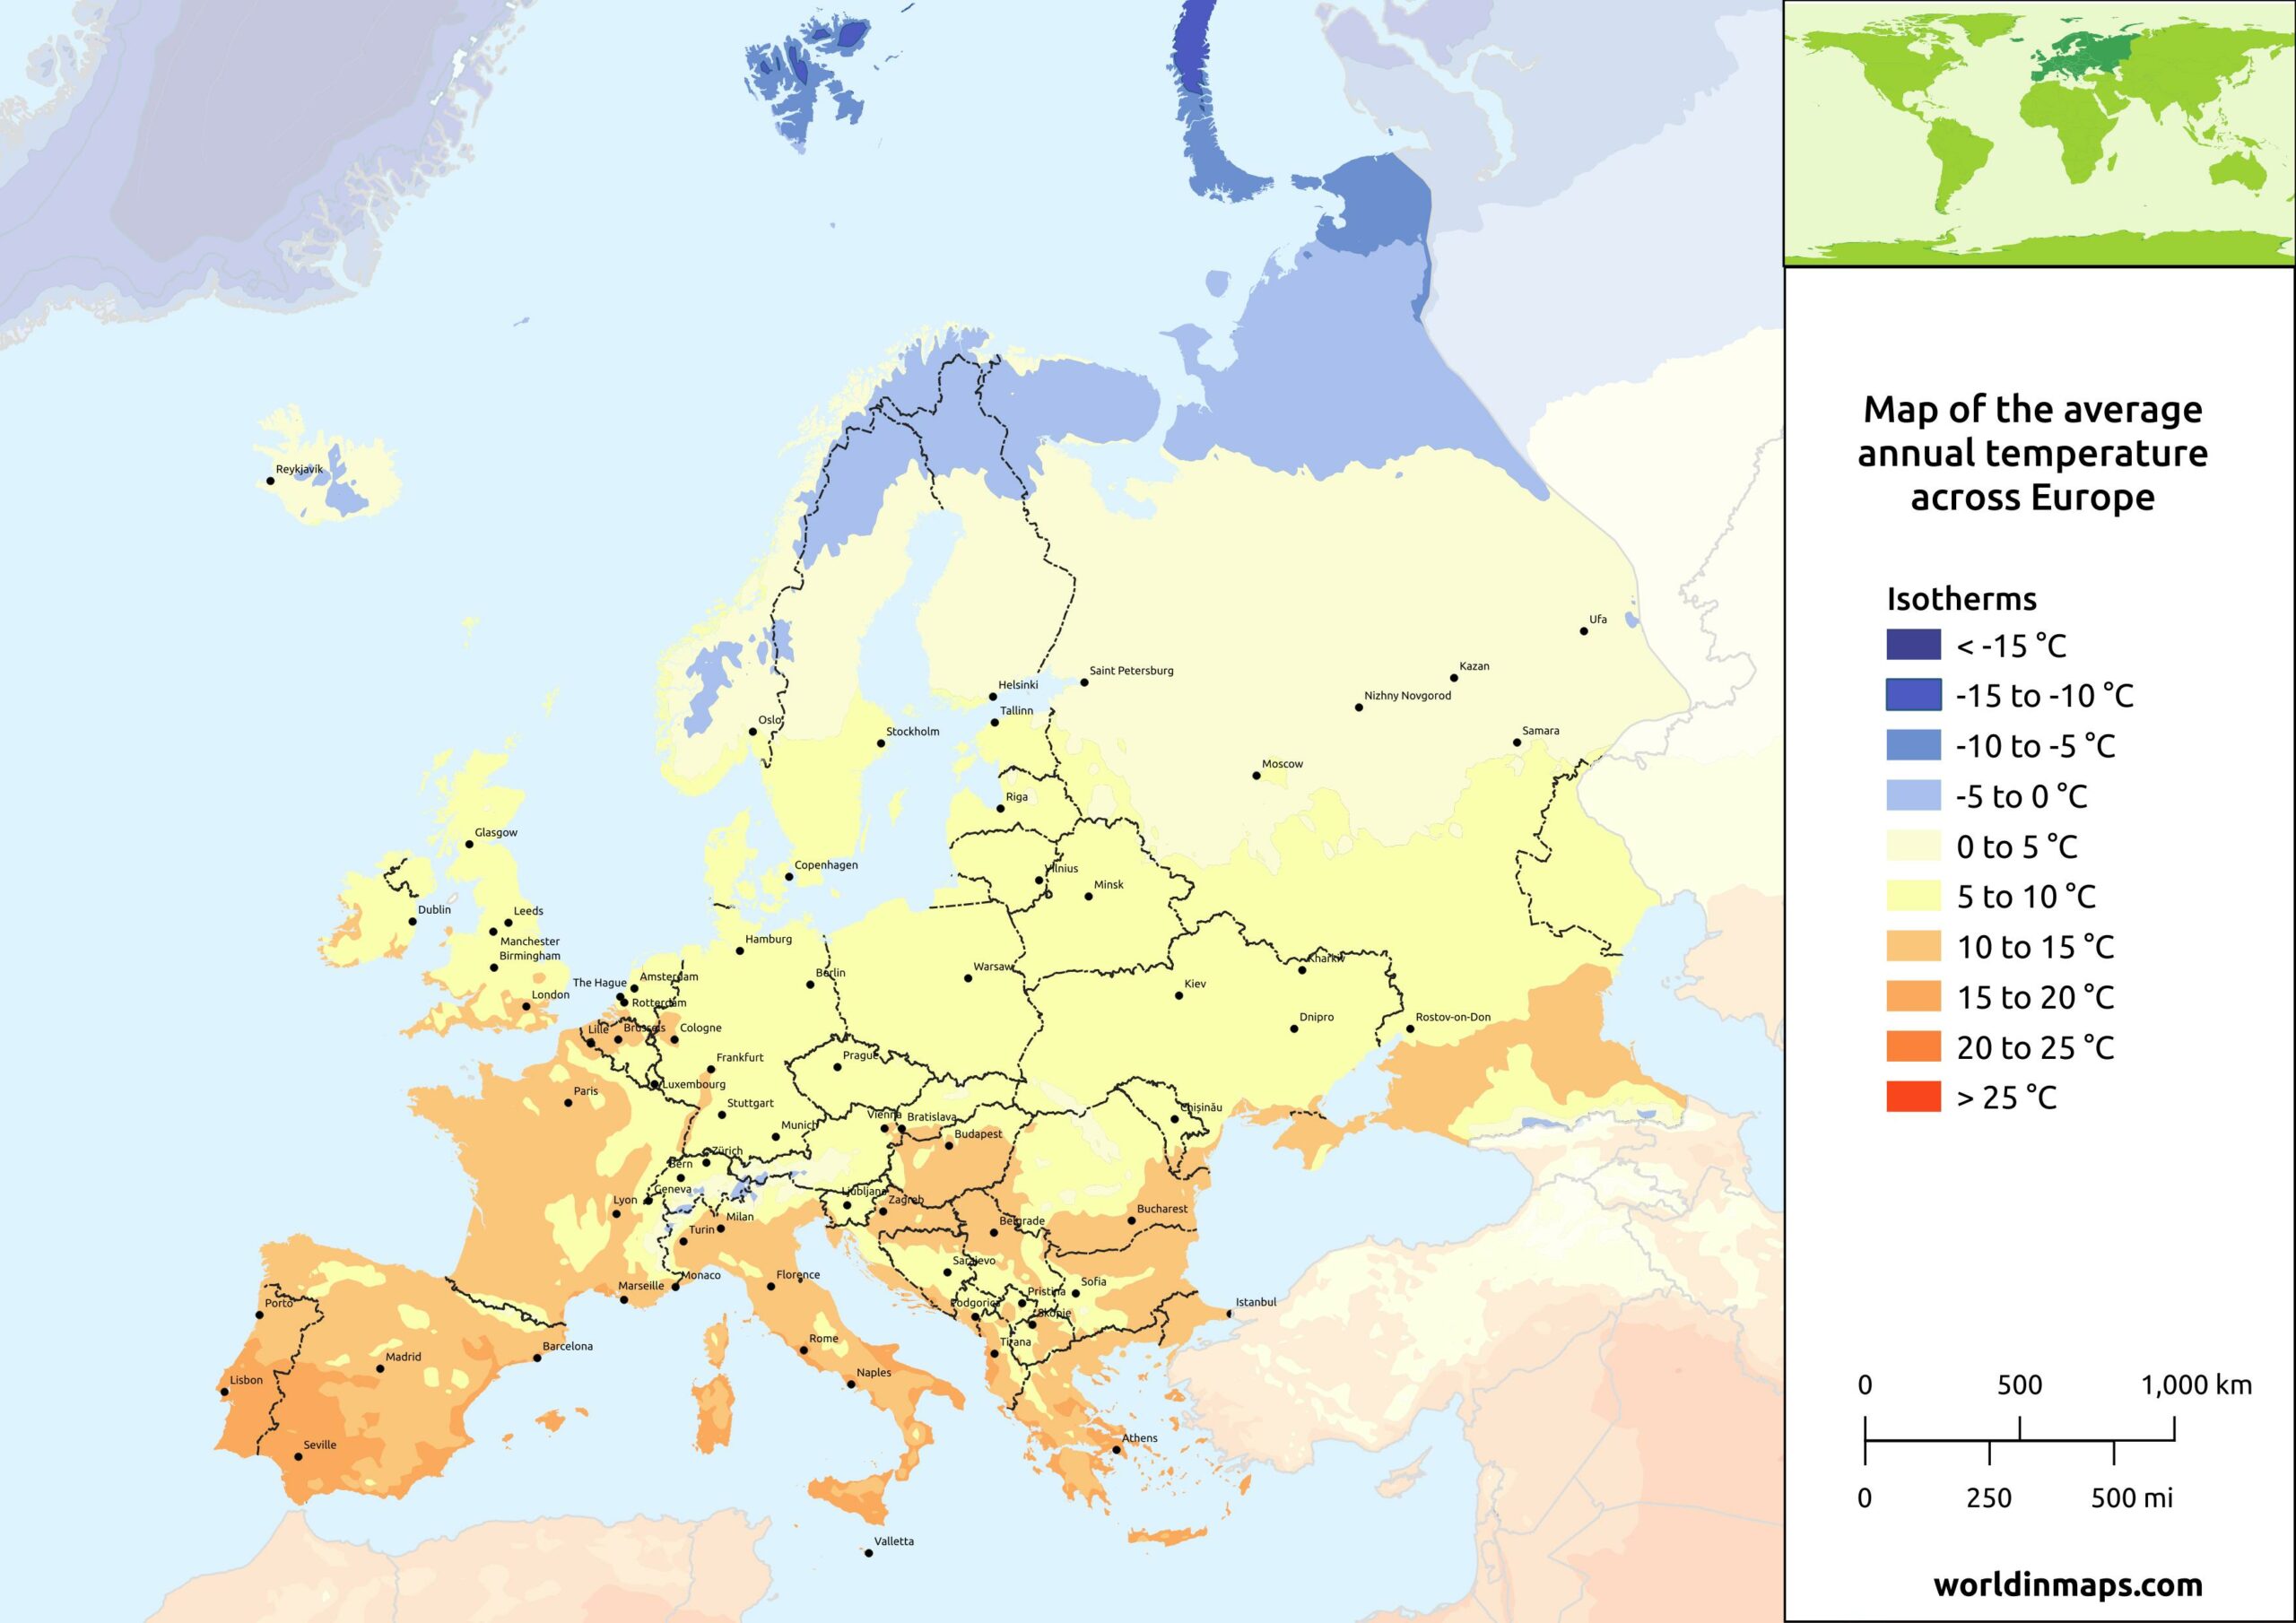
The climate of Europe is explained by its extend in latitude between 35° and 80° north, in other words 4 000 kilometers between Svalbard, located at the north of Scandinavia and the Mediterranean Sea. Because of this, the contrast of temperature is huge between the extreme north and south of the continent. The annual average temperature in the Severnaya Zemlya island, located in the north, is -12 °C and the temperature of Creta in the extreme south is 18,7°C.
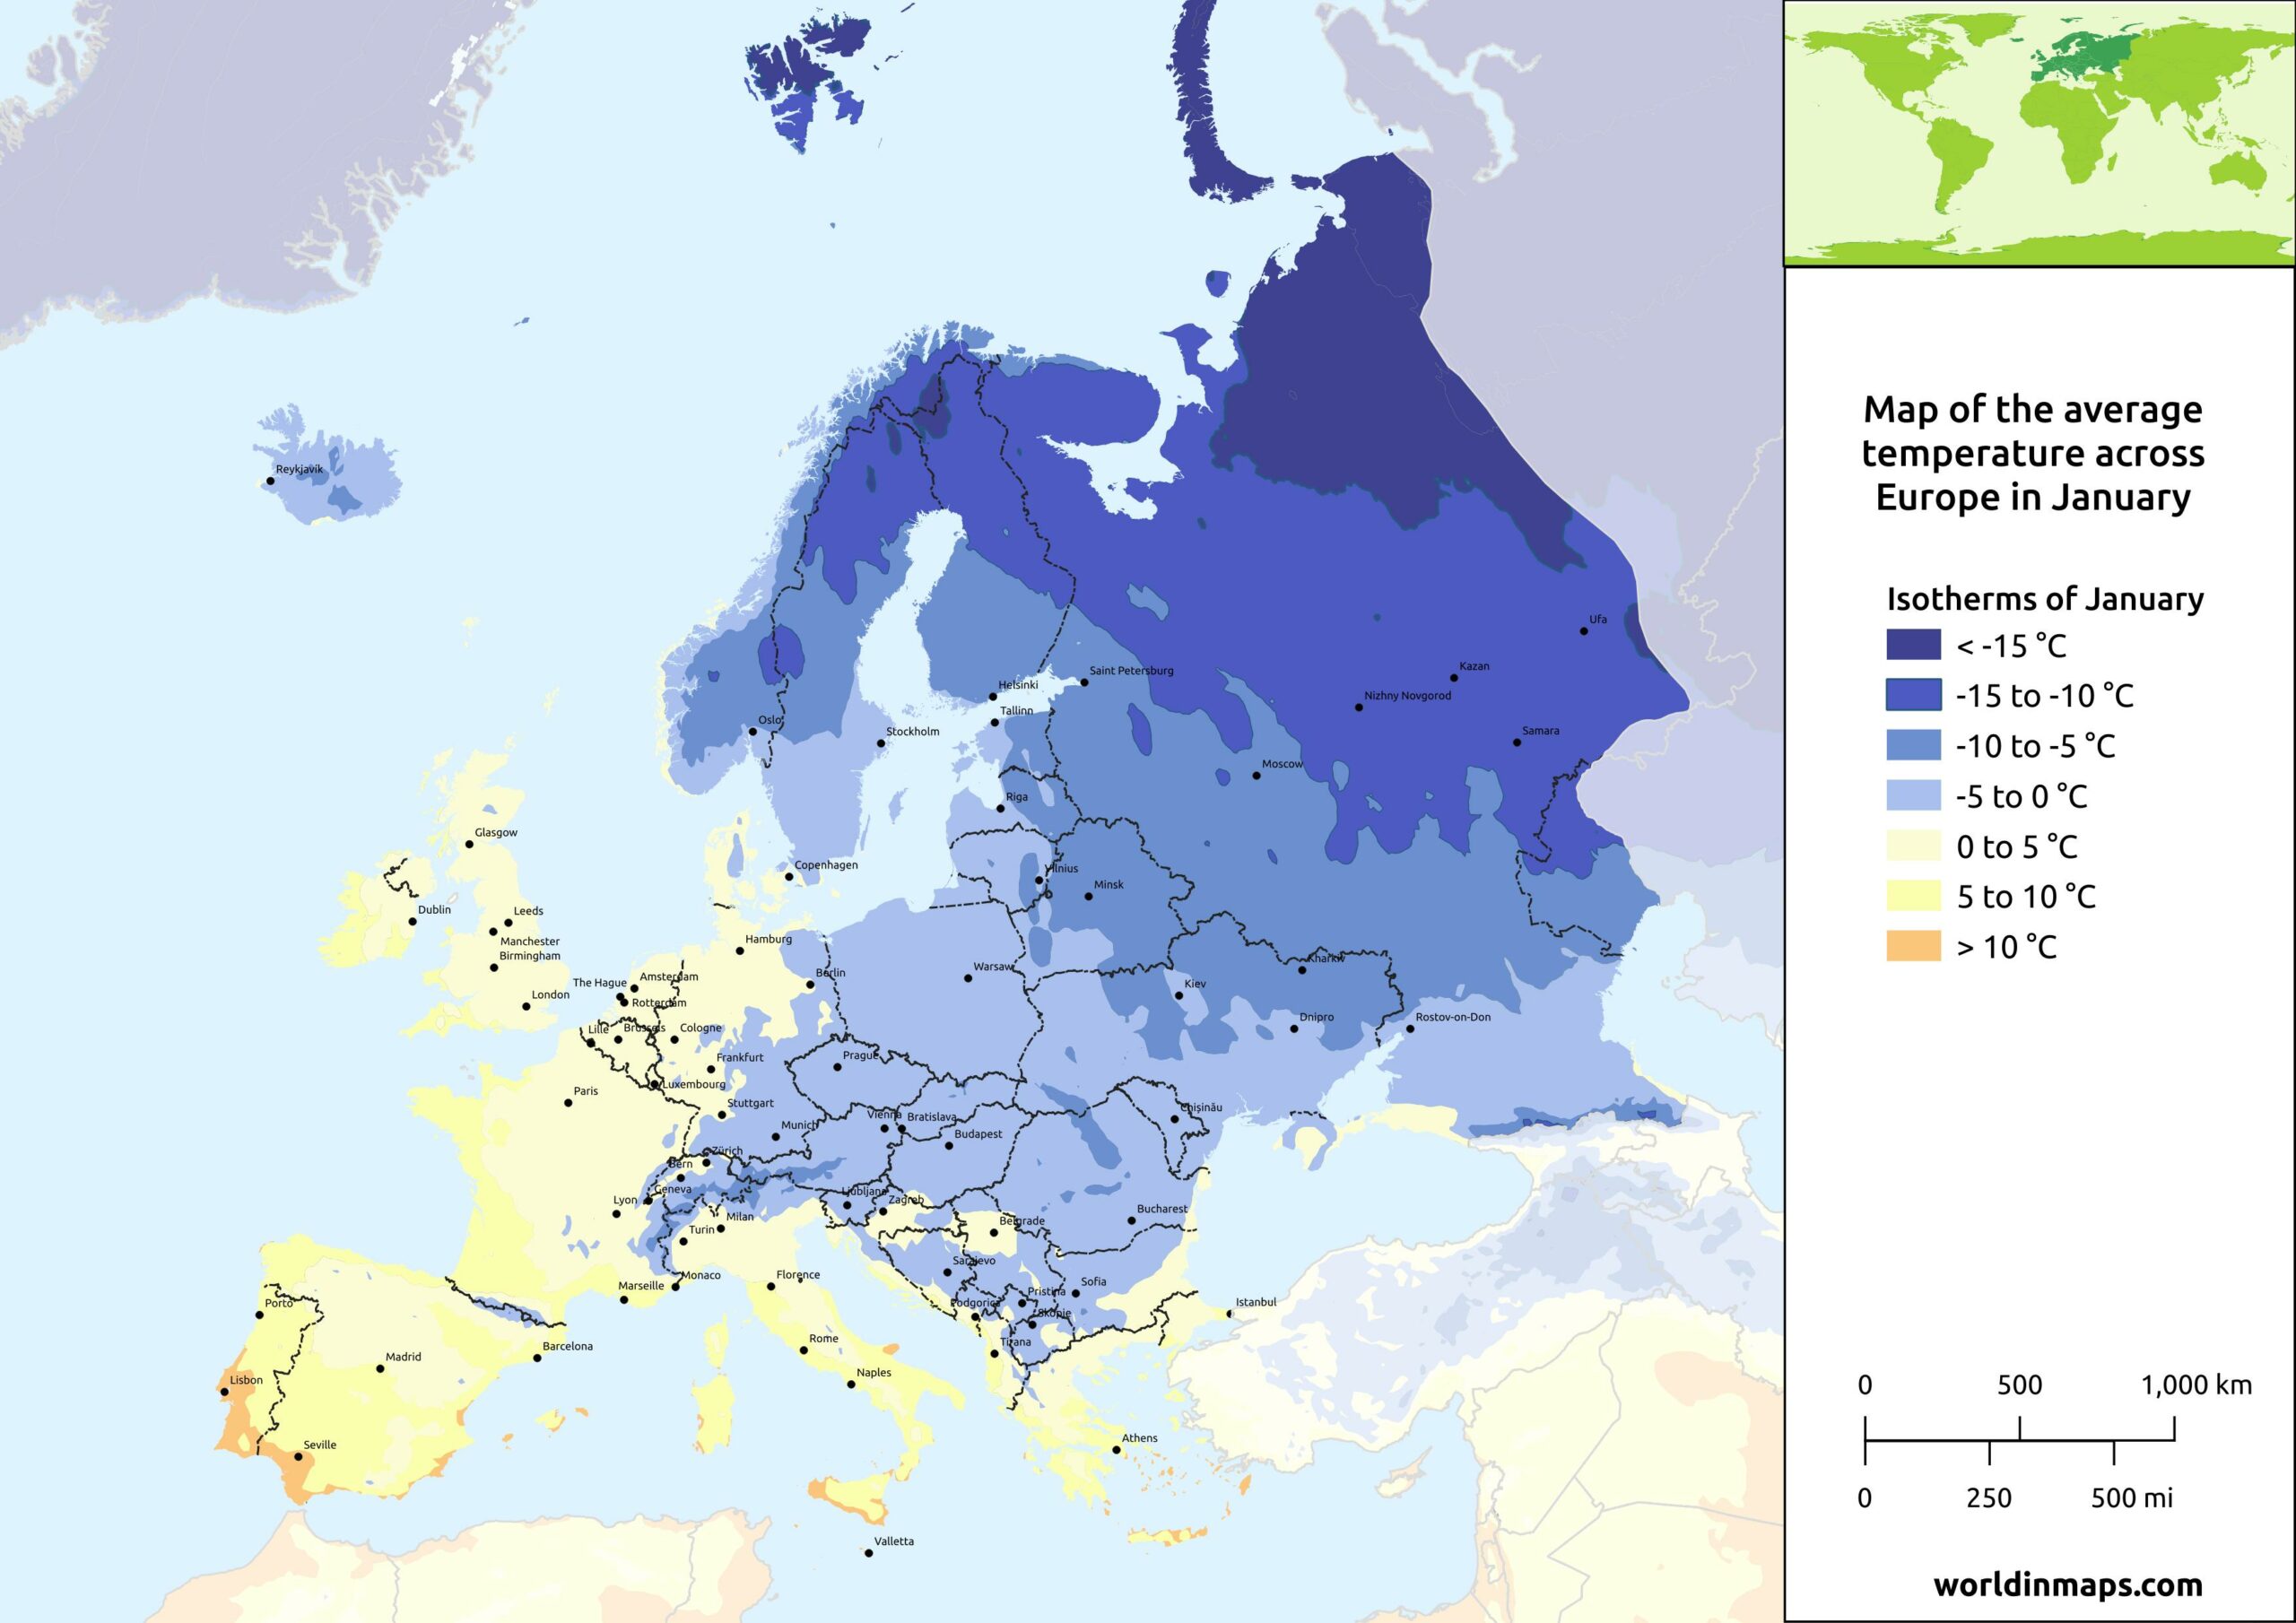
Europe has large coastal area, and the Atlantic Ocean but also the Mediterranean Sea helps to moderate the temperature over much of Europe. Indeed the Gulf stream brings warm water on the west coasts of Europe. Because of its latitude, Europe is submitted to westerlies. Air located above the Atlantic Ocean is warmed up by the Ocean and flows through the large plains of western and central Europe. This is particularly visible on the map of the average temperature for January.

In all seasons, this flow brings temperate air as we can see on the map of the average temperature of Europe in July.
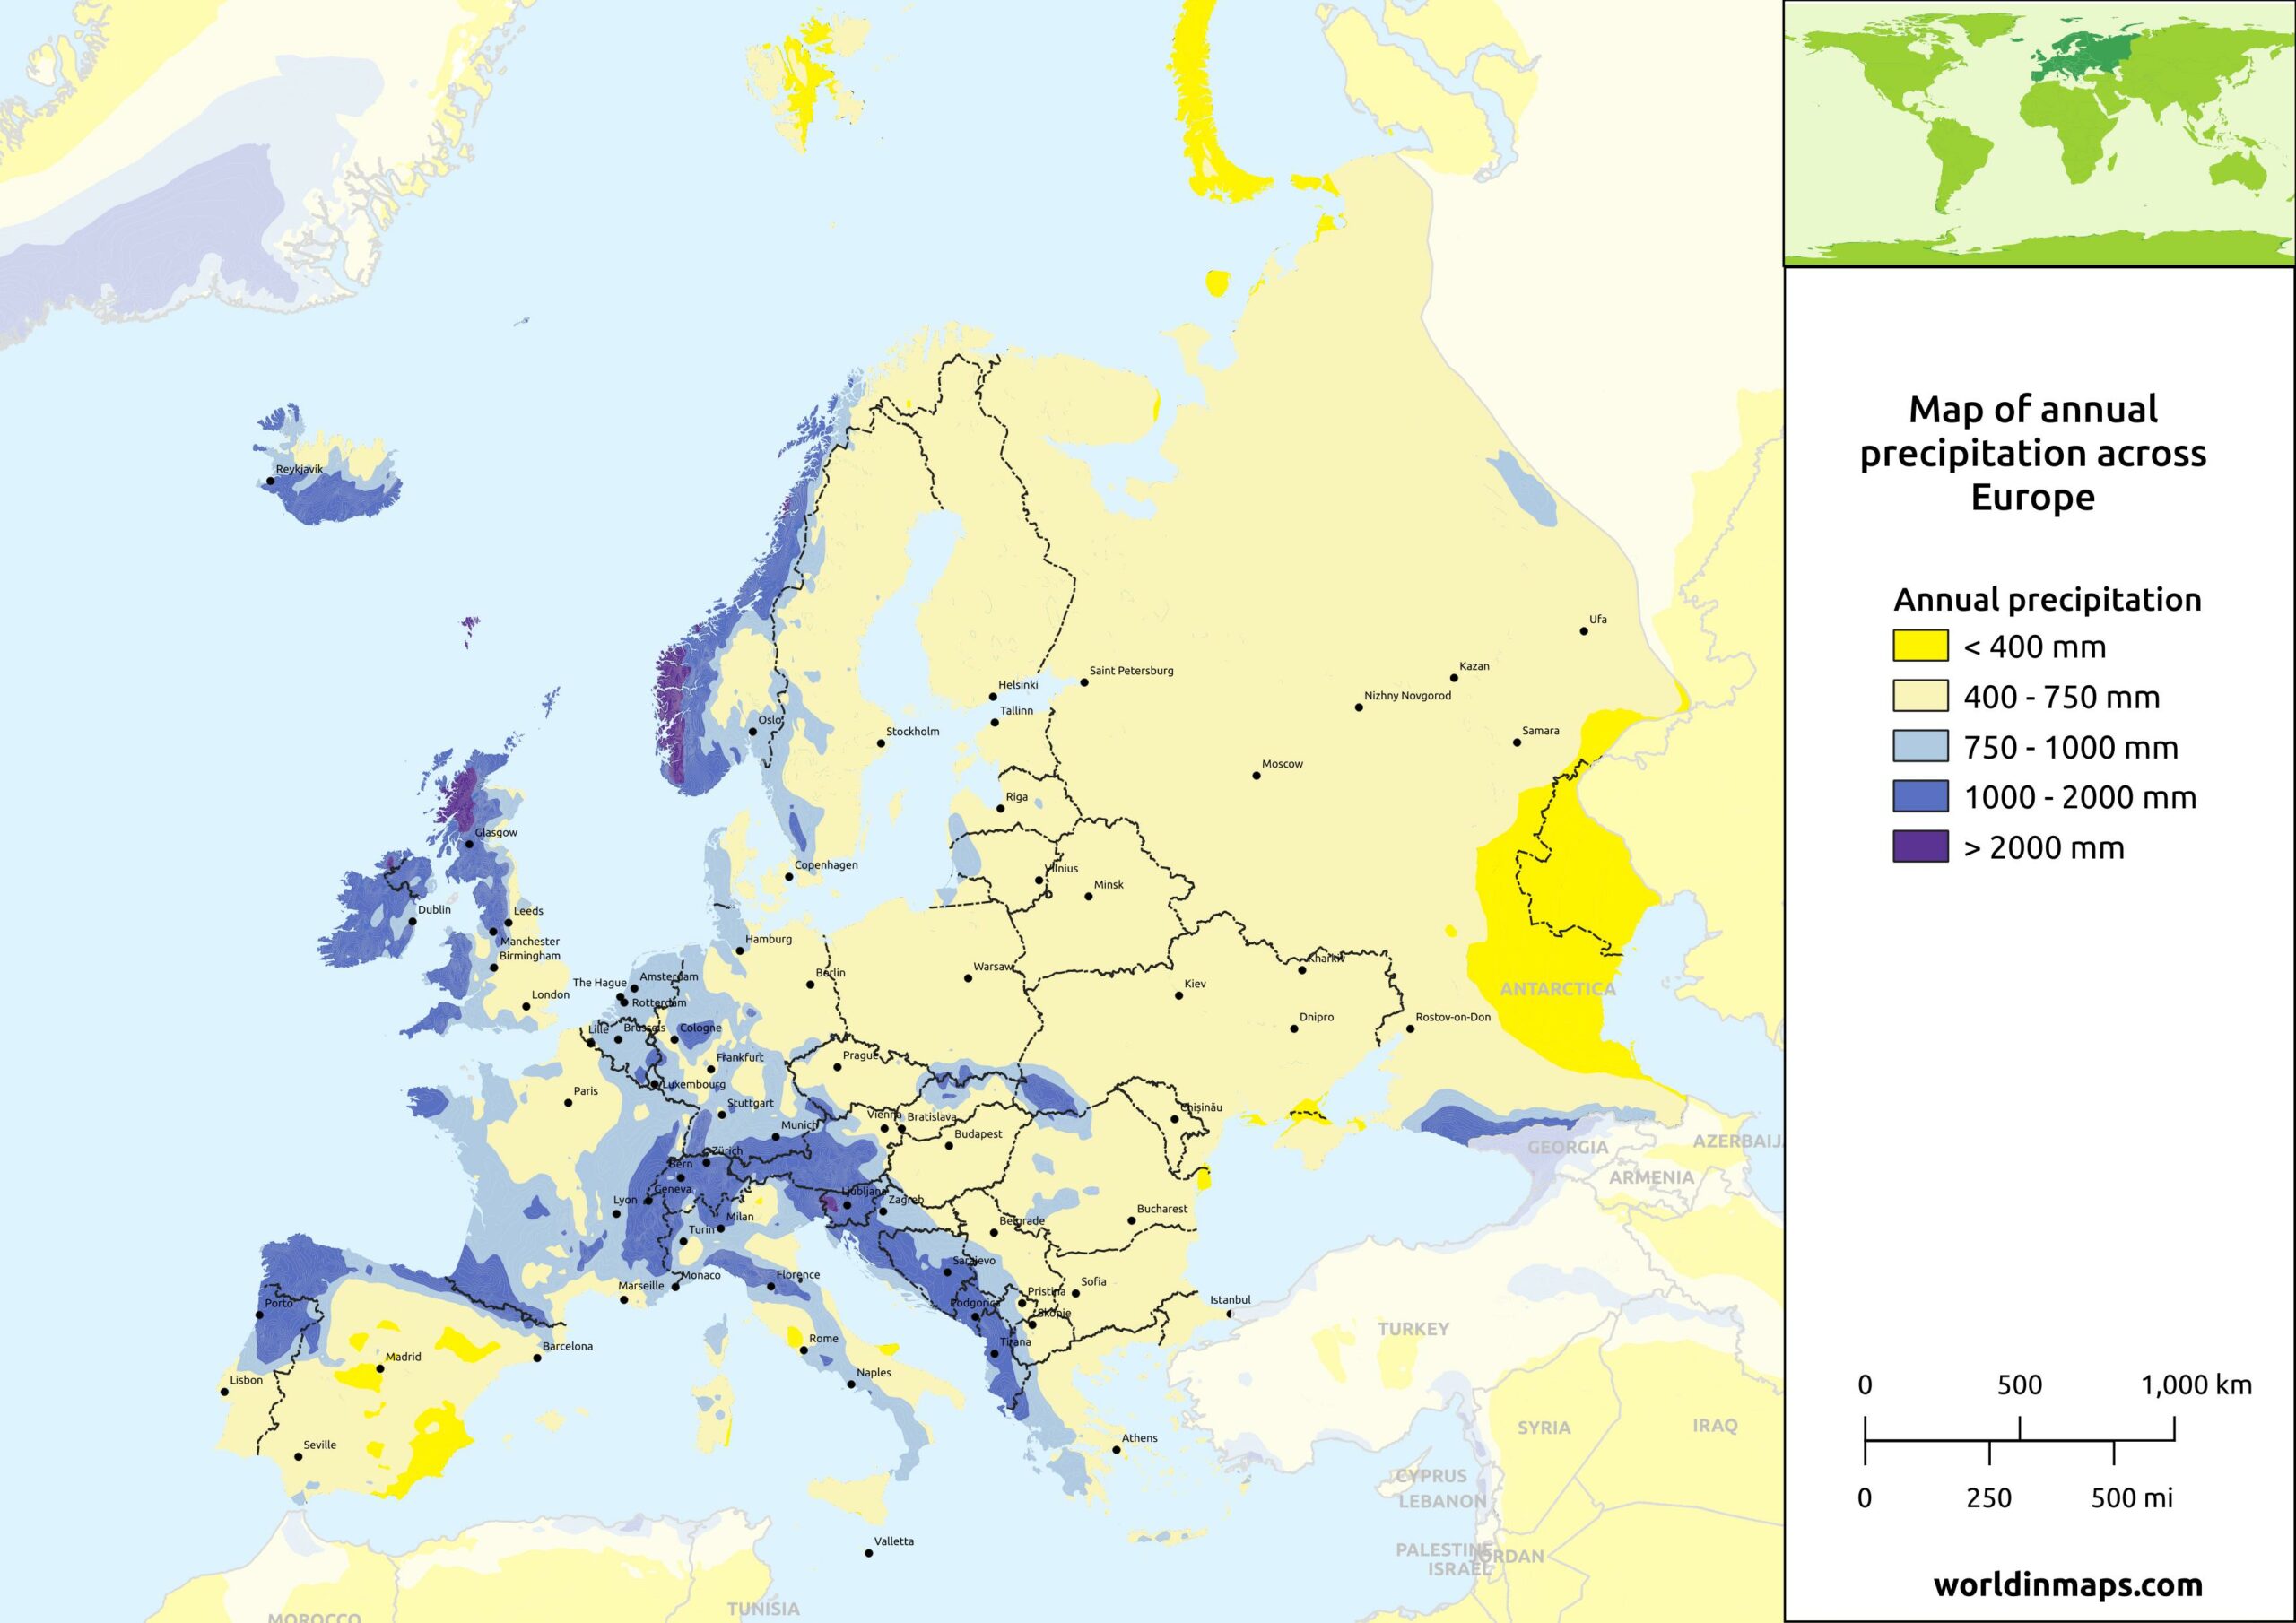
This flow brings also disturbance that allow regular rains in all seasons. Like shown by the map of annual rainfall, as it progresses inland, this flow is subject to continental influences and it becomes less temperate and gradually dries up, with precipitation becoming less regular.
To the east, the high pressures in the winter become more important and block the ocean flow. The consequence is a very cold and dry weather.
In the north, the Scandinavian mountains block the westerly winds and bring a cold continental climate on the eastern part of the Scandinavian peninsula.
The westerly winds see also their climatic importance decreasing in the south of Europe because of the latitude, the high summer pressures, and the mountain ranges that interposed most the time in the direction of the Mediterranean.