Weather and Climate | Home / Weather and Climate / The global atmospheric circulation
The global atmospheric circulation
Winds tend to change daily in function of the weather, but there is some regularity in the movement of the air masses. The global atmospheric circulation pattern explains this regularity of the air movement around the earth.
Table of contents
- Causes of the global atmospheric circulation
- What are the 3 types of atmospheric circulation cells?
- Walker circulation cell
- The Coriolis effect
- Jet stream winds
- Trade winds, westerlies and polar easterlies
- Intertropical convergence zone (ITCZ)
- Seasonal change in the atmospheric circulation and precipitation
- The atmospheric circulation cells and climatic zones
Causes of the global atmospheric circulation
The movement of the air masses on the earth’s surface is strongly depends on the temperature. Indeed, when the air is warmed it became less dense and it is gaining altitude. This form what is called a depression in meteorology. On the opposite, when air is cold, it is more dense and it tends to go down. This last system is called an anticyclone in meteorology.

To understand the global pattern of the atmospheric circulation, we need to take a look to the variation of the temperature on the earth. The distribution of the temperature on the earth is depending on the solar radiation. Indeed the sun warms the earth differently in function of the distance of the equator. At the equator, the sun is nearly vertical and intense. The most we move to the pole, how more the rays are inclined and therefore less intense. As a result, the equator receives more incoming solar radiation then the poles.
The earth emits back outgoing longwave radiation and a part of the solar radiation. These outgoing emissions are higher on the pole than at the equator. The net balance between outgoing and incoming is negative at the pole and positive at the equator. The global atmospheric circulation and the ocean circulation are responsible to redistribute the thermal energy at the earth’s surface. This atmospheric redistribution is divided into 3 different cells.
What are the 3 types of atmospheric circulation cells?
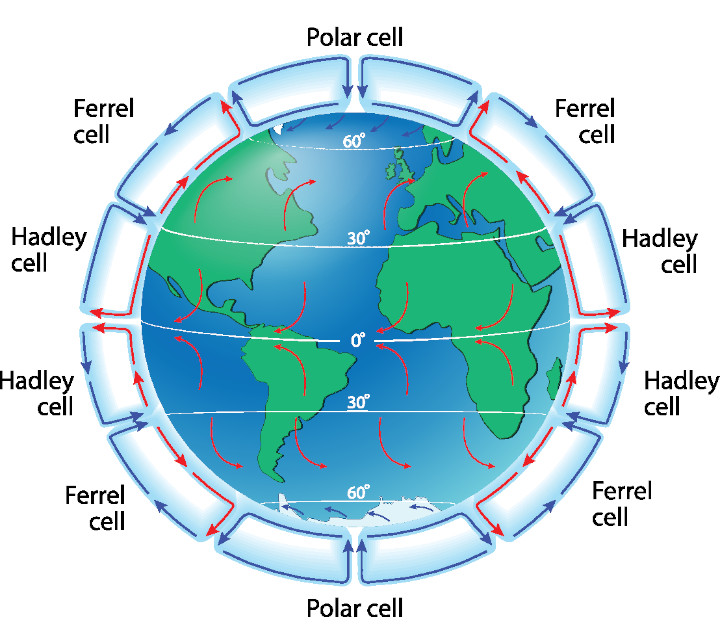
Hadley cell
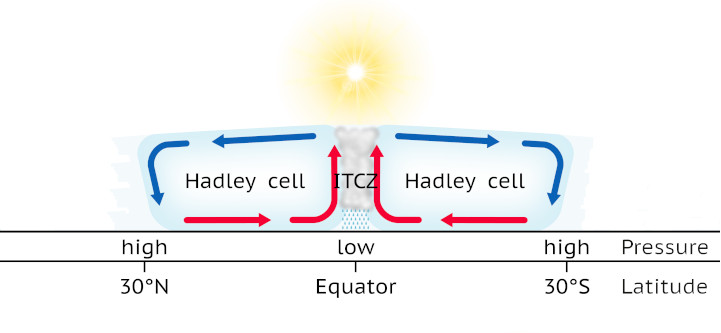
As explained in the previous chapter, the solar radiation is the highest at the equator. The result is a hot and wet air. This instable air masses create convection. Indeed, when the air gets hotter it expands and therefore becomes lighter. Because the air is lighter it will take altitude, which cause wind to replace the air that go up with air that come from the sides.
This convection causes low pressure zones near the equator and cumulonimbus clouds form with very high vertical extensions, which bring daily afternoon rain. These clouds stop their vertical extension at the tropopause (the boundary between the troposphere and the stratosphere with an altitude varying from around 8 km (25,000 ft) at the pole to around 18 km (60,000 ft) at the equator). Indeed, this boundary marks the inversion of the temperature rate. At this boundary, the temperature stop to become colder with the altitude and the air is dry once this limit is passed. As a result, it stops the vertical extension of the cumulonimbus cloud at an altitude of around 18 km (60,000 ft) at the equator.
Because the air is blocked at the tropopause, it starts to move to the sides towards the poles. While moving to the tropics, the air cools and it becomes denser. Finally, it is so dense that it descends around the tropics (latitude of 30°). This creates high pressure zones around the tropics with dry air. Finally, the air masses flow back to the equator at the surface of the earth.
This type of cell is at the number of 2, one on each side of the equator. This cell type is the biggest of the 3 types.
Polar cell
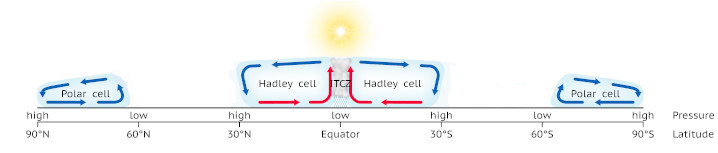
The Polar cell is the most little of the 3 types of cells. This cell is located at each pole.
At the pole the air is cold and dense, by consequence, it descends to the ground. Then it flows to a latitude of around 60° North for the cell at the North pole and South for the cell at the South pole. While moving to this latitude the air start to warm and it rises in the atmosphere at around 60° latitude to go back to the pole.
Ferrel cell
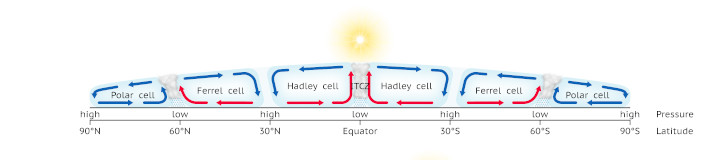
This cell is located between the Polar cell and the Hadley cell, in other word between the latitude of around 30° and 60°. Unlike the 2 other cells, this cell is not driven by temperature. This cell exists only because of the existence of the other cells. This cell is also different because the circulation of this cell is in the opposite direction than the Polar and Hadley cells.
Walker circulation cell
Next to the 3 majors cells defined above and that divide the earth from pole to pole, there is the Walker circulation cell which, on the opposite to the other cells, is circum-equatorial. In other words, this cell is located along the equator, and so perpendicular to the 3 major cells. This cell is caused by the intensity contrast of heating between the continents and the oceans, which create convection and subsidence zones along the equator. The Walker cell is the convection and subsidence system located in the Pacific Ocean.
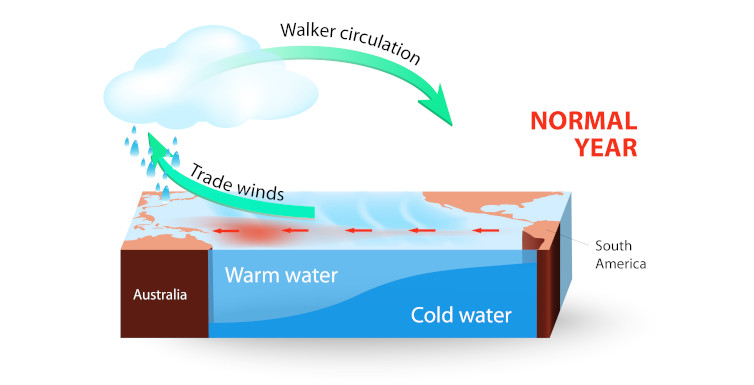
The Walker cell is more exactly located between Australia and South America. The trade winds blow from East to West and brings Warm ocean water towards the low pressure system located in Indonesia and Australia. On the opposite we have on the coast of South America an upwelling of deep cold water and the cold current of Humbold (also called the Peru Current) with as a consequence a high pressure system. This results in a dry weather on the west coast of South America.
The accumulation of warm ocean water along Indonesia and Australia lead to active convection with heavy rainfall and thunderstorms. The air parcel raises until the troposphere and then flows back and cools to South America, to the subsidence area located on the high pressure system along the coast of South America.
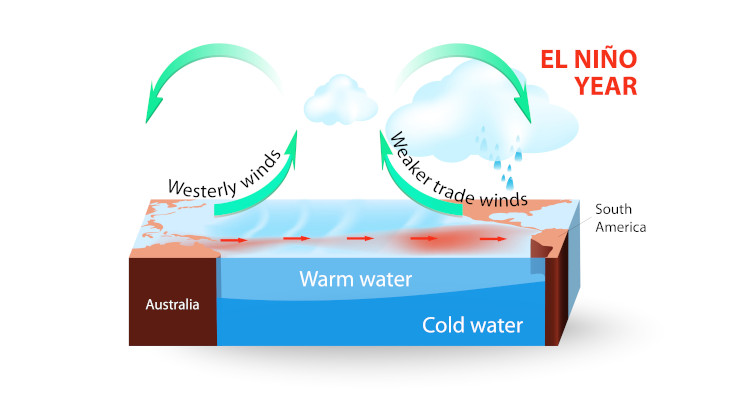
The cycle above describes the normal cycle of Walker. But during a few months of the year the trade winds may be weak, which allow the pilled hot water of the western Pacific to move to the eastern Pacific. This change totally the oceanic current and the atmospheric circulation in the area. By consequence, it blocks the upwelling of cold water on the coast of South America and the water become more warm. This phenomenon starts a bit after Christmas and finish in April. This has consequence on the fish activity because with the disappearing of the upwelling the nutriments for the fish disappears and the fish also with them. Finally the coast, that is normally very arid, is also affected by rainfall. This modification of the cycle of Walker is named ENSO (El Niño – Southern Oscillation).
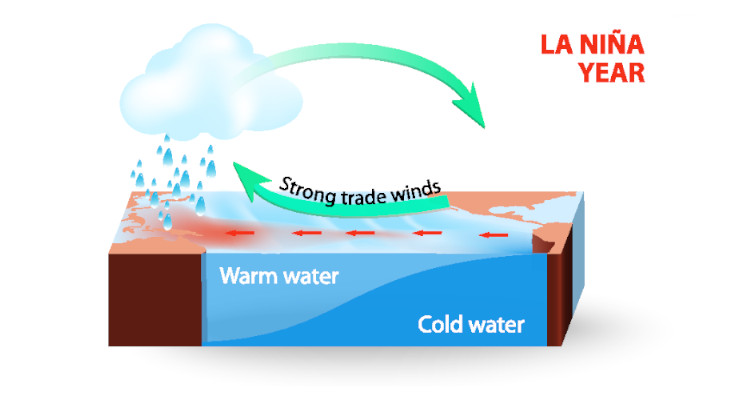
On the opposite, we have the La Niña which is an amplification of the trade winds, which push further the warm ocean water on the western pacific. This allows the deep cold water to occupy a bigger part of the eastern Pacific. The consequence on the coast of South America is a better fishing activity, but also a more long dry weather. It also gives colder winter in North America because the warm water is pushed further away in the western pacific. It gives also more hurricane in the Atlantic ocean.
The Coriolis effect
The Coriolis effect is the consequence of the earth rotation. Indeed the earth makes a full turn in 24h, but a point on the pole have 0 km (0 mi) to do in 24h. On the opposite, a point at the equator have 40 074 km (24,901 mi) to do in 24h. In the tropics of the Cancer and the Capricorn the length is 36 814 km (22,875 mi). By consequence a point will move at a speed of 1 670 km/h (1,037 mph) at the equator and 1534 km/h (953 mph) at the tropics.
These differences in speed have a consequence on the moving air in the atmosphere. In the northern hemisphere the winds are deviated to the right and in the southern hemisphere the winds are deviated to the left.
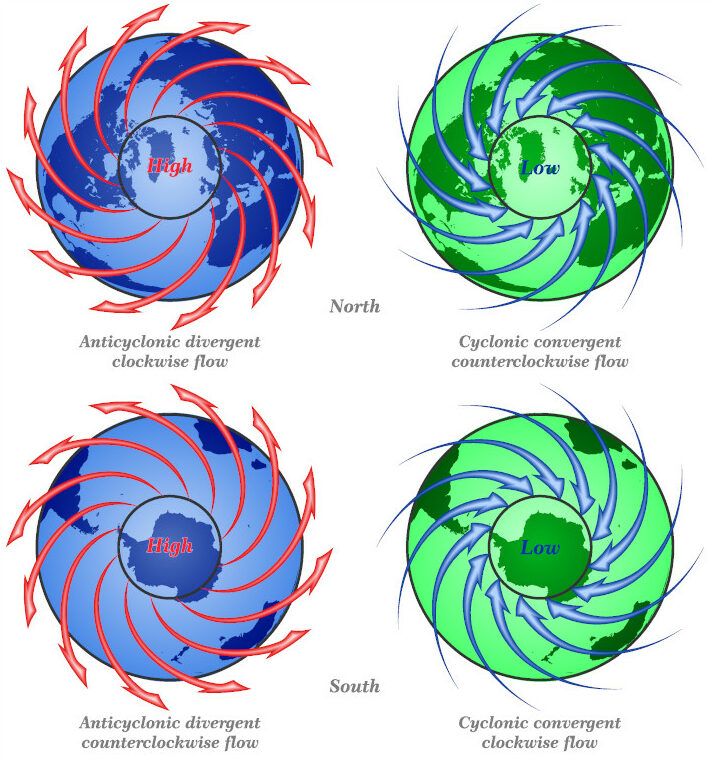
The Coriolis effect explains why the air in a low pressure system is counterclockwise in the northern hemisphere. Indeed, this deflection twists the air flowing inwards to right, creating a counterclockwise swirl of winds.
In a high pressure system, the air flows outward and the deflection has as result a clockwise rotation.
In the southern hemisphere it is the opposite and so the air flows clockwise for low pressure systems and counterclockwise for high pressure systems.
Jet stream winds
The Coriolis effect is responsible for the creation of narrow bands of very strong winds called jet stream. These winds are very strong and can have maximal speed above the 360 km/h (225 mph). This winds are located at front area between the different cells.
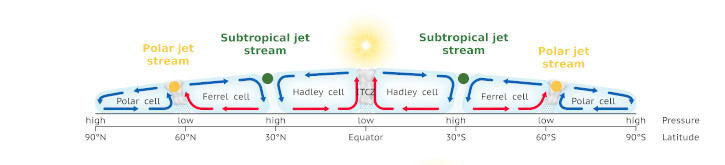
The subtropical jet streams are located between the Hadley cells and the Ferrel cells. They mark the limit between temperate area and more hot areas. They are located around 12 and 15 km of altitude (40,000 and 50,000 ft) and their position vary in function of the seasons.
The polar jet streams are located between the Ferrel cells and the Polar cells at an altitude of 11 and 13 km (36,000 and 40,000 ft). They delimit the temperate areas of the cold areas. These jet streams are located at the so called polar front and they are the result of the contrast of temperature across the polar front. More is the contrast of temperature more strong is the jet stream. As a consequence, these jet streams are stronger in the winter than in the summer. Indeed the difference of temperature is stronger in the winter.
Trade winds, westerlies and polar easterlies
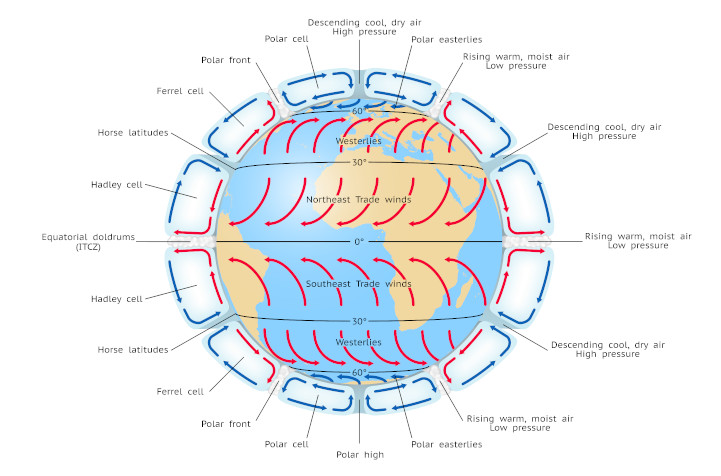
Another consequence of the Coriolis force is the deviation of the winds at the surface. The deviation of this winds in the Hadley cell form the persistent trade winds. In the Northern hemisphere, these winds flow from the tropic of the Cancer (60°N latitude) to the equator and from the tropic of the Capricorn (60°S latitude) to the equator in the southern hemisphere. These are deviated to the west to form northeast trade winds in the northern hemisphere and southeast trade winds in the southern Hemisphere.
The surface winds in the Ferrel cells flow from south to north (from the tropic of Cancer to the Arctic circle) in the northern hemisphere and from north to south (from the tropic of Capricorn to the Antarctic circle) in the southern hemisphere. These winds are deviated to the east. They form the southwest westerlies in the northern hemisphere and the northwest westerlies in the southern hemisphere.
The same happens in the Polar cells. The winds flow from the poles to the polar fronts and they are deviated to the West in both hemispheres, to form the polar easterlies.
Intertropical convergence zone (ITCZ)
The intertropical convergence zone is the region where the northeast trade winds from the northern hemisphere and the southeast trade winds from the southern hemisphere converge and rise to the troposphere. This zone encircle the earth and it is located near the equator.
Seasonal change in the atmospheric circulation and precipitation

Because of the earth inclination and the rotation around the sun, the solar radiation is not the same at a point all the year. That is why we have season’s and that they are not the same between the northern hemisphere and the southern hemisphere. These seasons also affect the position of the different cells.
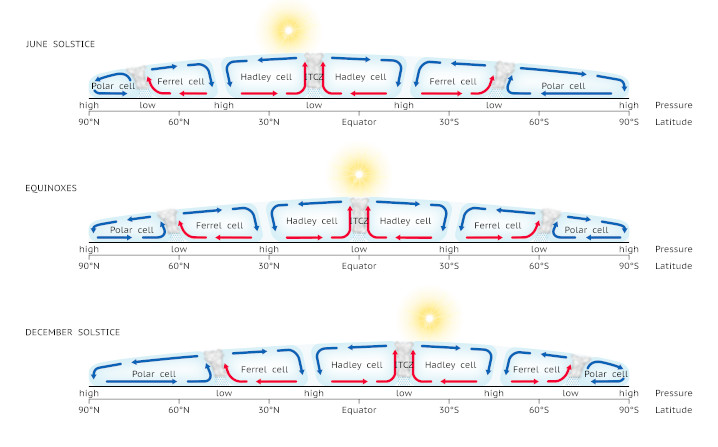
When it is summer in the northern hemisphere, the cells and the intertropical convergence zone move a few degrees to the north. On the opposite, in December the cells and also the intertropical convergence zone move to the south.

This leads to big local change in some area of the earth like the monsoon in India. In the winter the intertropical convergence zone is clearly defined and located in the Indian ocean, which lead to northeast continental winds. In the summer, the intertropical convergence zone is less defined and located above the continent and it brings southwest winds filled with rain.
The atmospheric circulation cells and climatic zones
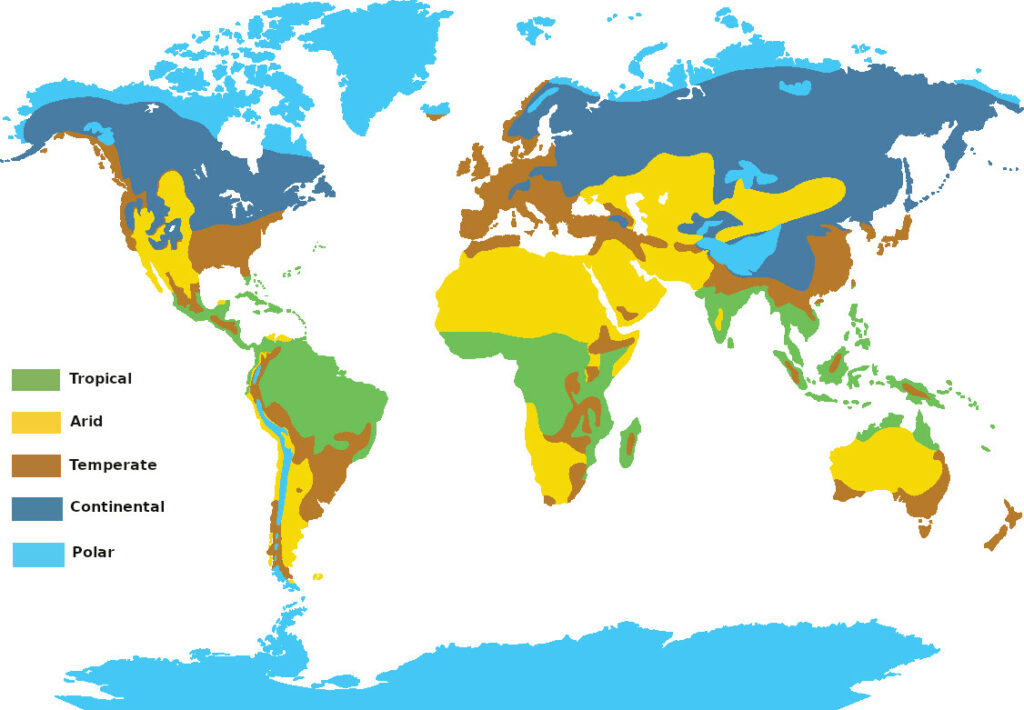
As explained previously, the different cells have an influence on the weather by defining semi permanent high and low pressure zone. And so the cells define the location of the different climatic zones of the earth.
Because of these cells, we have regions of semi permanent high and low pressure areas. At location of low pressure system, there is much more rainfall. On the opposite, high pressure areas give clear skies and so by consequence little rainfall, which leads to desert (cold and hot deserts).
That is why the largest areas of rainforest are located around the equator, because of the high solar radiation and the intertropical convergence zone that have as consequence daily afternoon rain, with a hot and wet atmosphere.
Arid climates, and so deserts, are located at the upper limit of the Hadley cells where dry air descends from the tropopause.
Polar regions are of course located at the pole and they are the consequence of the low solar radiation at the pole.