Canada
| Government | |
| Name | Canada |
| Government type | Federal parliamentary democracy under a constitutional monarchy (a Commonwealth realm) |
| Capital | Ottawa (934,243 (2016)) |
| Currency | Canadian dollar (CAD) |
| Organization | |
| Member State | Commonwealth of Nations |
| People | |
| Population (2020) | 37,742,157 (38th) |
| Density of population | 3.92 P/km2 (228th) |
| Nationality | Canadian |
| Official languages | |
| English | |
| French | |
| Ethnic groups (2016)1 | |
| Canadian | 32.3% |
| English | 18.3% |
| Scottish | 13.9% |
| French | 13.6% |
| Irish | 13.4% |
| German | 9.6% |
| Chinese | 5.1% |
| Italian | 4.6% |
| North American Indian | 4.4% |
| East Indian | 4% |
| Other | 51.6% |
| Religions (2011) | |
| Catholic | 39% |
| Roman Catholic | 38.8% |
| Other Catholic | 0.2% |
| Protestant | 20.3% |
| United Church | 6.1% |
| Anglican | 5% |
| Baptist | 1.9% |
| Lutheran | 1.5% |
| Pentecostal | 1.5% |
| Presbyterian | 1.4% |
| Other Protestant | 2.9% |
| Orthodox | 1.6% |
| Other Christian | 6.3% |
| Muslim | 3.2% |
| Hindu | 1.5% |
| Sikh | 1.4% |
| Buddhist | 1.1% |
| Jewish | 1% |
| Other | 0.6% |
| None | 23.9% |
| Life expectancy (2020) | |
| Male | 81.1 years |
| Female | 85.9 years |
| Total population | 83.4 years (6th) |
| Homicides | |
| Total (2018) | 1.8 per 100,000 people (111th) |
| Geography | |
| Land area | 9,093,507 km2 |
| water area | 891,163 km2 |
| total area | 9,984,670 km2 (3rd) |
| Mean elevation | 487 m |
| Lowest point | |
| Atlantic Ocean | 0 m |
| Highest point | |
| Mount Logan | 5,959 m |
| Land use (2011) | |
| Agricultural land | 6.8% |
| Arable land | 4.7% |
| Permanent crops | 0.5% |
| Permanent pasture | 1.6% |
| Forest | 34.1% |
| Other | 59.1% |
| Urbanization | |
| Urban population (2020) | 81.6% |
| Rate of urbanization | 0.97% annual rate of change (2015 – 2020) |
| Economy | |
| Labor force (2017) | 19.52 million (31st) |
| Labor force by occupation (2006) | |
| Agriculture | 2% |
| Industry | 13% |
| Services | 6% |
| Industry and services | 76% |
| Manufacturing | 3% |
| Unemployment rate (2017) | 6.3% (94th) |
| GDP (PPP) (estimate 2020) | |
| Total | $1.971 trillion (16th) |
| Per capita | $52,144(21st) |
| GDP (nominal) (estimate 2020) | |
| Total | $1.812 trillion (10th) |
| Per capita | $47,931 (17th) |
| GDP by sector (estimate 2017) | |
| Agriculture | 1.6% |
| Industry | 28.2% |
| Services | 70.2% |
| Exports (2017) | $423.5 billion (11st) |
| Exports partners (2017) | |
| US | 76.4% |
| China | 4.3% |
| Imports (2017) | $442.1 billion (12th) |
| Imports partners (2017) | |
| US | 51.5% |
| China | 12.6% |
| Mexico | 6.3% |
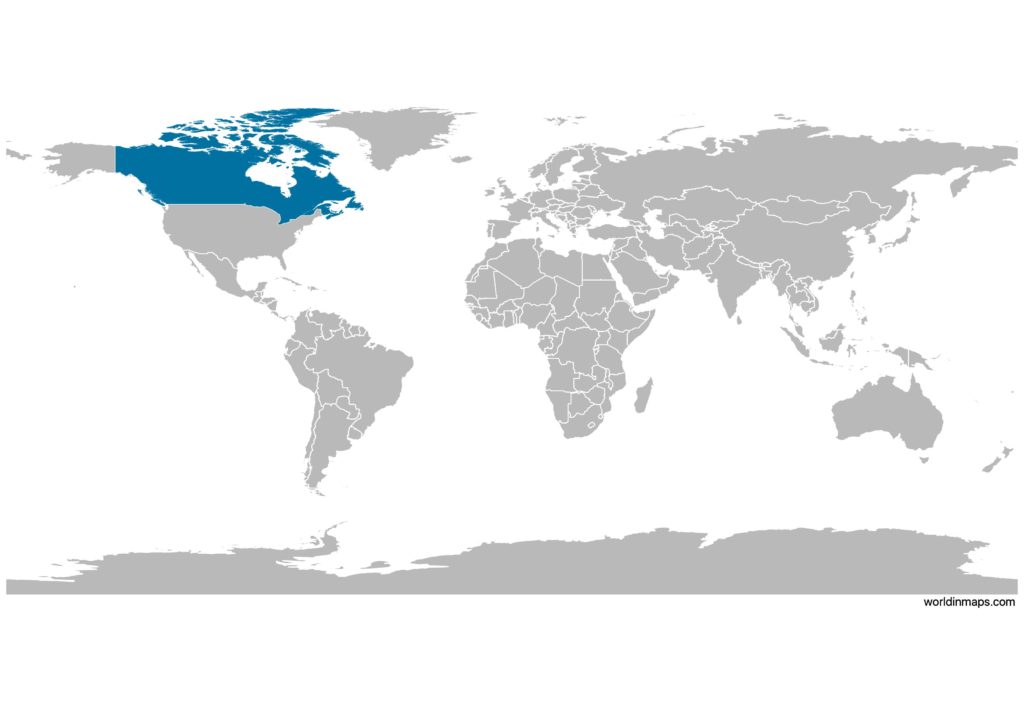
Canada on the world map
Canada top 10 largest cities (2016)
- Toronto (2,731,571)
- Montreal (1,704,694)
- Calgary (1,239,220)
- Ottawa (934,243)
- Edmonton (932,546)
- Mississauga (721,599)
- Winnipeg (705,244)
- Vancouver (631,486)
- Brampton (593,638)
- Hamilton (536,917)
Demography
Population pyramid
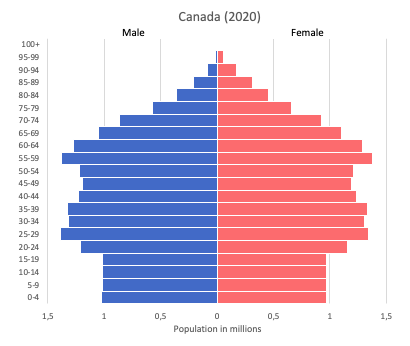
Age structure data
Estimate for 2020:
- 0-14 years: 15.99% (male 3,094,008/female 2,931,953)
- 15-24 years: 11.14% (male 2,167,013/female 2,032,064)
- 25-54 years: 39.81% (male 7,527,554/female 7,478,737)
- 55-64 years: 14.08% (male 2,624,474/female 2,682,858)
- 65 years and over: 18.98% (male 3,274,298/female 3,881,126)
Remark: the age structure of a population affects a nation’s key socioeconomic issues. Countries with young populations (high percentage under age 15) need to invest more in schools, while countries with older populations (high percentage ages 65 and over) need to invest more in the health sector. The age structure can also be used to help predict potential political issues. For example, the rapid growth of a young adult population unable to find employment can lead to unrest.
Population from 1950 to 2020
Source: United Nations, Department of Economic and Social Affairs, Population Division (2019). World Population Prospects 2019, Online Edition. Rev. 1.
Evolution of the life expectancy from 1960 to 2018
Source: World Development Indicators, The World Bank
Economy
Agriculture:
wheat, barley, oilseed, tobacco, fruits, vegetables, dairy products, fish, forest products
Industries:
transportation equipment, chemicals, processed and unprocessed minerals, food products, wood and paper products, fish products, petroleum, natural gas
Exports – commodities:
motor vehicles and parts, industrial machinery, aircraft, telecommunications equipment, chemicals, plastics, fertilizers, wood pulp, timber, crude petroleum, natural gas, electricity, aluminum
Imports – commodities:
machinery and equipment, motor vehicles and parts, crude oil, chemicals, electricity, durable consumer goods
Time zone and current time in Canada
Go to our interactive map to get the current time in Canada
Source:
- CIA World Factbook
- United Nations, Department of Economic and Social Affairs, Population Division. World Population Prospects: The 2019 Revision. (Medium variant)
- Wikipedia
1 Percentages add up to more than 100% because respondents were able to identify more than one ethnic origin