Democratic Republic of the Congo
| Government | |
| Name | Democratic Republic of the Congo |
| French | République démocratique du Congo |
| Kongo | Repubilika ya Kôngo ya Dimokalasi |
| Lingala | Republíki ya Kongó Demokratíki |
| Swahili | Jamhuri ya Kidemokrasia ya Kongo |
| Luba-Katanga | Ditunga dia Kongu wa Mungalaata |
| Government type | Semi-presidential republic |
| Capital | Kinshasa 11,116,000 (2016)) |
| Currency | Congolese franc (CDF) |
| People | |
| Population (2020) | 89,561,404 (14th) |
| Density of population | 39.19 P/km2 |
| Nationality | Congolese |
| Official languages | |
| French | |
| Recognised national languages | |
| Lingala | |
| Kikongo | |
| Swahili | |
| Tshiluba | |
| Ethnic groups | |
| There are more than 200 African ethnic groups. The majority of them are Bantu. The four largest tribes make up about 45% of the population. These largest tribes are Mongo (Bantu), Luba (Bantu), Kongo (Bantu) and the Mangbetu-Azande (Hamitic). | |
| Religions (2014) | |
| Roman Catholic | 29.9% |
| Protestant | 26.7% |
| Kimbanguist | 2.8% |
| Other Christian | 36.5% |
| Muslim | 1.3% |
| Other | 1.2% |
| None | 1.3% |
| Unspecified | 0.2% |
| Life expectancy (2020) | |
| Male | 59.3 years |
| Female | 62.8 years |
| Total population | 61 years (216th) |
| Homicides | |
| n.a. | |
| Geography | |
| Land area | 2,267,048 km2 |
| water area | 77,810 km2 |
| total area | 2,344,858 km2 (12nd) |
| Mean elevation | 726 m |
| Lowest point | |
| Atlantic Ocean | 0 m |
| Highest point | |
| Pic Marguerite on Mont Ngaliema (Mount Stanley) | 5,110 m |
| Land use (2011) | |
| Agricultural land | 11.4% |
| Arable land | 3.1% |
| Permanent crops | 0.3% |
| Permanent pasture | 8% |
| Forest | 67.9% |
| Other | 20.7% |
| Urbanization | |
| Urban population (2020) | 45.6% |
| Rate of urbanization | 4.53% annual rate of change (2015 – 2020) |
| Economy | |
| Labor force (2017) | 31.36 million (18th) |
| Labor force by occupation | |
| Agriculture | NA |
| Industry | NA |
| Services | NA |
| Unemployment rate | NA |
| GDP (PPP) (estimate 2019) | |
| Total | $77.486 billion |
| Per capita | $843 |
| GDP (nominal) (estimate 2019) | |
| Total | $46.117 billion |
| Per capita | $501 |
| GDP by sector (estimate 2017) | |
| Agriculture | 19.7% |
| Industry | 43.6% |
| Services | 36.7% |
| Exports (2017) | $10.98 billion (89th) |
| Exports partners (2017) | |
| China | 41.4% |
| Zambia | 22.7% |
| South Korea | 7.2% |
| Finland | 6.2% |
| Imports (2017) | $10.82 billion (100th) |
| Imports partners (2017) | |
| China | 19.9% |
| South Africa | 18% |
| Zambia | 10.4% |
| Belgium | 9.1% |
| India | 4.3% |
| Tanzania | 4.2% |
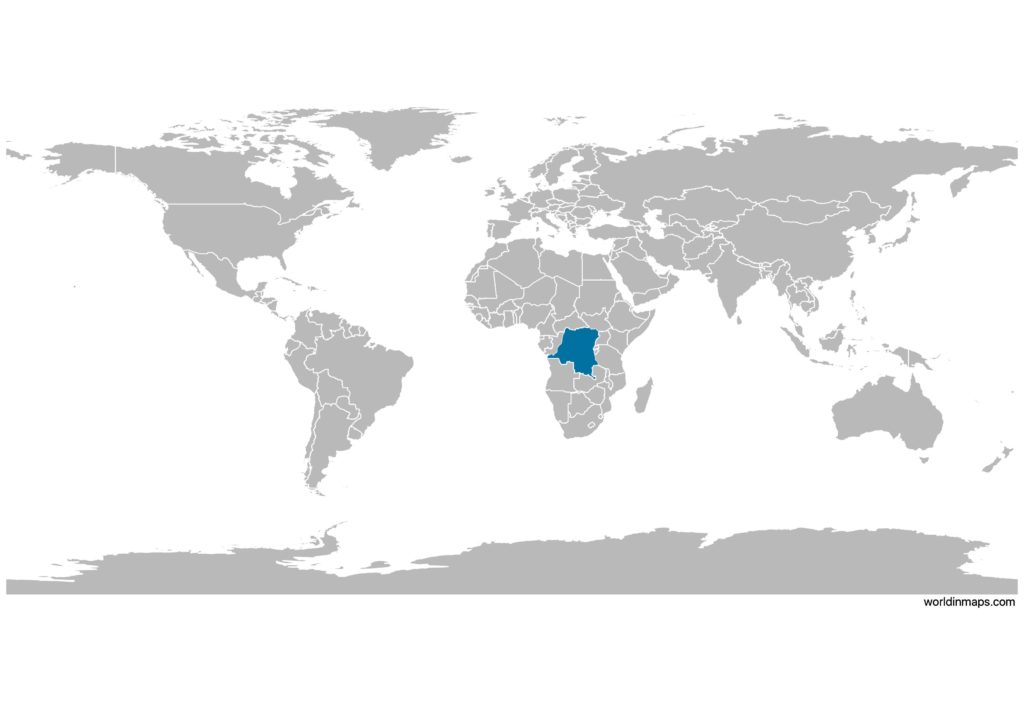
Democratic Republic of the Congo on the world map
Democratic Republic of the Congo top 10 largest cities (2016)
- Kinshasa (11,116,000)
- Lubumbashi (1,936,000)
- Mbuji-Mayi (1,919,000)
- Kananga (1,119,000)
- Kisangani (1,001,000)
- Goma (1,000,000)
- Bukavu (1,000,000)
- Tshikapa (600,000)
- Masina (485,167)
- Kolwezi (453,147)
Demography
Population pyramid
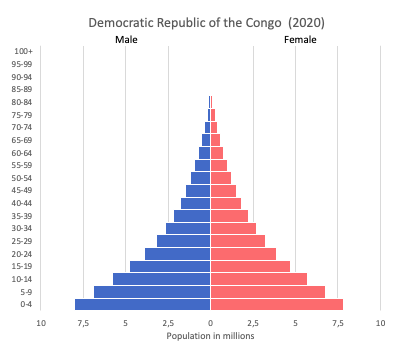
Age structure data
Estimate for 2020:
- 0-14 years: 46.38% (male 23,757,297/female 23,449,057)
- 15-24 years: 19.42% (male 9,908,686/female 9,856,841)
- 25-54 years: 28.38% (male 14,459,453/female 14,422,912)
- 55-64 years: 3.36% (male 1,647,267/female 1,769,429)
- 65 years and over: 2.47% (male 1,085,539/female 1,423,782)
Remark: the age structure of a population affects a nation’s key socioeconomic issues. Countries with young populations (high percentage under age 15) need to invest more in schools, while countries with older populations (high percentage ages 65 and over) need to invest more in the health sector. The age structure can also be used to help predict potential political issues. For example, the rapid growth of a young adult population unable to find employment can lead to unrest.
Population from 1950 to 2020
Source: United Nations, Department of Economic and Social Affairs, Population Division (2019). World Population Prospects 2019, Online Edition. Rev. 1.
Evolution of the life expectancy from 1960 to 2018
Source: World Development Indicators, The World Bank
Economy
Agriculture:
coffee, sugar, palm oil, rubber, tea, cotton, cocoa, quinine, cassava (manioc, tapioca), bananas, plantains, peanuts, root crops, corn, fruits; wood products
Industries:
mining (copper, cobalt, gold, diamonds, coltan, zinc, tin, tungsten), mineral processing, consumer products (textiles, plastics, footwear, cigarettes), metal products, processed foods and beverages, timber, cement, commercial ship repair
Exports – commodities:
diamonds, copper, gold, cobalt, wood products, crude oil, coffee
Imports – commodities:
foodstuffs, mining and other machinery, transport equipment, fuels
Time zone and current time in Democratic Republic of the Congo
Go to our interactive map to get the current time in Democratic Republic of the Congo