Estonia

| Government | |
| Name | Republic of Estonia |
| Estonian | Eesti Vabariik |
| Government type | Parliamentary republic |
| Capital | Tallinn (434,562 (2017)) |
| Currency | Euro (EUR) |
| People | |
| Population (2020) | 1,326,539 (57th) |
| Density of population | 28 P/km2 (149th) |
| Nationality | Estonian |
| Official languages | |
| Estonian | |
| Ethnic groups (2011) | |
| Estonian | 68.7% |
| Russian | 24.8% |
| Ukrainian | 1.7% |
| Belarusian | 1% |
| Finn | 0.6% |
| Other | 1.6% |
| Unspecified | 1.6% |
| Religions (2011) | |
| Orthodox | 16.2% |
| Lutheran | 9.9% |
| Other Christian | 2.2% |
| Other | 0.9% |
| None | 54.1% |
| Unspecified | 16.7% |
| Life expectancy (2020) | |
| Male | 72.7 years |
| Female | 82.3 years |
| Total population | 77.4 years (82nd) |
| Homicides | |
| Total (2018) | 2.1 per 100,000 people (106th) |
| Geography | |
| Land area | 42,388 km2 |
| water area | 2,840 km2 |
| total area | 45,228 km2 (133rd) |
| Mean elevation | 61 m |
| Lowest point | |
| Baltic Sea | 0 m |
| Highest point | |
| Suur Munamagi | 318 m |
| Land use (2011) | |
| Agricultural land | 22.2% |
| Arable land | 14.9% |
| Permanent crops | 0.1% |
| Permanent pasture | 7.2% |
| Forest | 52.1% |
| Other | 25.7% |
| Urbanization | |
| Urban population (2020) | 69.2% |
| Rate of urbanization | 0.01% annual rate of change (2015 – 2020) |
| Economy | |
| Labor force (2017) | 670,200 (152nd) |
| Labor force by occupation (2017) | |
| Agriculture | 2.7% |
| Industry | 20.5% |
| Services | 76.8% |
| Unemployment rate (2017) | 5.8% (88th) |
| GDP (PPP) (estimate 2020) | |
| Total | $49.644 billion |
| Per capita | $37,605(43rd) |
| GDP (nominal) (estimate 2020) | |
| Total | $32.742 billion (23rd) |
| Per capita | $24,802 (35th) |
| GDP by sector (estimate 2017) | |
| Agriculture | 2.8% |
| Industry | 29.2% |
| Services | 68.1% |
| Exports (2017) | $13.44 billion (79th) |
| Exports partners (2017) | |
| Finland | 16.2% |
| Sweden | 13.5% |
| Latvia | 9.2% |
| Russia | 7.3% |
| Germany | 6.9% |
| Lithuania | 5.9% |
| Imports (2017) | $14.42 billion (90th) |
| Imports partners (2017) | |
| Finland | 14% |
| Germany | 10.7% |
| Lithuania | 8.9% |
| Sweden | 8.5% |
| Latvia | 8.2% |
| Poland | 7.2% |
| Russia | 6.7% |
| Netherlands | 5.9% |
| China | 4.7% |
Estonia on the world map
Estonia top 10 largest cities (2017)
- Tallinn (434,562)
- Tartu (96,974)
- Narva (55,249)
- Pärnu (50,643)
- Kohtla-Järve (33,743)
- Viljandi (17,407)
- Maardu (15,332)
- Rakvere (15,189)
- Kuressaare (13,097)
- Haapsalu (13,077)
Demography
Population pyramid
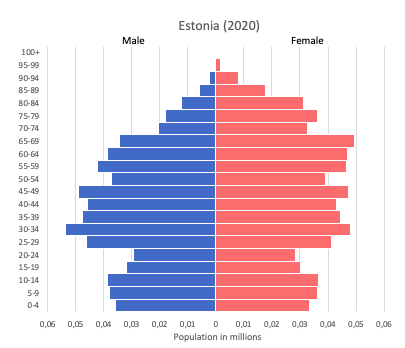
Age structure data
Estimate for 2020:
- 0-14 years: 16.22% (male 102,191/female 97,116)
- 15-24 years: 8.86% (male 56,484/female 52,378)
- 25-54 years: 40.34% (male 252,273/female 243,382)
- 55-64 years: 13.58% (male 76,251/female 90,576)
- 65 years and over: 21% (male 89,211/female 168,762)
Remark: the age structure of a population affects a nation’s key socioeconomic issues. Countries with young populations (high percentage under age 15) need to invest more in schools, while countries with older populations (high percentage ages 65 and over) need to invest more in the health sector. The age structure can also be used to help predict potential political issues. For example, the rapid growth of a young adult population unable to find employment can lead to unrest.
Population from 1950 to 2020
Source: United Nations, Department of Economic and Social Affairs, Population Division (2019). World Population Prospects 2019, Online Edition. Rev. 1.
Evolution of the life expectancy from 1960 to 2018
Source: World Development Indicators, The World Bank
Economy
Agriculture:
grain, potatoes, vegetables, livestock and dairy products, fish
Industries:
food, engineering, electronics, wood and wood products, textiles, information technology, telecommunications
Exports – commodities (2016):
machinery and electrical equipment 30%, food products and beverages 9%, mineral fuels 6%, wood and wood products 14%, articles of base metals 7%, furniture and bedding 11%, vehicles and parts 3%, chemicals 4%
Imports – commodities (2015):
machinery and electrical equipment 28%, mineral fuels 11%, food and food products 10%, vehicles 9%, chemical products 8%, metals 8%
Time zone and current time in Estonia
Go to our interactive map to get the current time in Estonia