Latvia

| Government | |
| Name | Republic of Latvia |
| Latvian | Latvijas Republika |
| Government type | Parliamentary republic |
| Capital | Riga (632,614 (2019)) |
| Currency | Euro (EUR) |
| People | |
| Population (2020) | 1,886,202 (150th) |
| Density of population | 34.3 P/km2 (166th) |
| Nationality | Latvian |
| Official languages | |
| Latvian | |
| Ethnic groups (2018) | |
| Latvian | 62.2% |
| Russian | 25.2% |
| Belarusian | 3.2% |
| Ukrainian | 2.2% |
| Polish | 2.1% |
| Lithuanian | 1.2% |
| other | 1.5% |
| unspecified | 2.3% |
| Religions (2017) | |
| Lutheran | 36.2% |
| Roman Catholic | 19.5% |
| Orthodox | 19.1% |
| other Christian | 1.6% |
| other | 0.1% |
| unspecified / none | 23.5% |
| Life expectancy (2020) | |
| Male | 70.9 years |
| Female | 80.1 years |
| Total population | 75.4 years (116th) |
| Homicides | |
| Total (2018) | 4.4 per 100,000 people (70th) |
| Geography | |
| Land area | 62,249 km2 |
| water area | 2,340 km2 |
| total area | 64,589 km2 (125th) |
| Mean elevation | 87 m |
| Lowest point | |
| Baltic Sea | 0 m |
| Highest point | |
| Gaizina Kalns | 312 m |
| Land use (2011) | |
| Agricultural land | 29.2% |
| Arable land | 18.6% |
| Permanent crops | 0.1% |
| Permanent pasture | 10.5% |
| Forest | 54.1% |
| Other | 16.7% |
| Urbanization | |
| Urban population (2020) | 68.3% |
| Rate of urbanization | -0.93% annual rate of change (2015 – 2020) |
| Economy | |
| Labor force (2017) | 990,000 (144th) |
| Labor force by occupation (2016) | |
| Agriculture | 7.7% |
| Industry | 24.1% |
| Services | 68.1% |
| Unemployment rate (2017) | 8.7% (124th) |
| GDP (PPP) (estimate 2020) | |
| Total | $63.490 billion |
| Per capita | $32,986 |
| GDP (nominal) (estimate 2020) | |
| Total | $36.771 billion |
| Per capita | $19,105 |
| GDP by sector (estimate 2017) | |
| Agriculture | 3.9% |
| Industry | 22.4% |
| Services | 73.7% |
| Exports (2017) | $12.84 billion (81st) |
| Exports partners (2017) | |
| Lithuania | 15.8% |
| Russia | 14% |
| Estonia | 10.9% |
| Germany | 6.9% |
| Sweden | 5.7% |
| UK | 4.9% |
| Poland | 4.3% |
| Denmark | 4.1% |
| Imports (2017) | $15.79 billion (86th) |
| Imports partners (2017) | |
| Lithuania | 17.6% |
| Germany | 11.7% |
| Poland | 8.7% |
| Estonia | 7.6% |
| Russia | 7.1% |
| Netherlands | 4.2% |
| Finland | 4.2% |
| Italy | 4% |
Latvia on the world map
Latvia largest cities (2019)
- Riga (632,614)
- Daugavpils (82,604)
- Liepāja (68,945)
- Jelgava (55,972)
- Jūrmala (49,325)
- Ventspils (34,377)
- Rēzekne (27,820)
- Valmiera (23,125)
- Jēkabpils (22,076)
Demography
Population pyramid
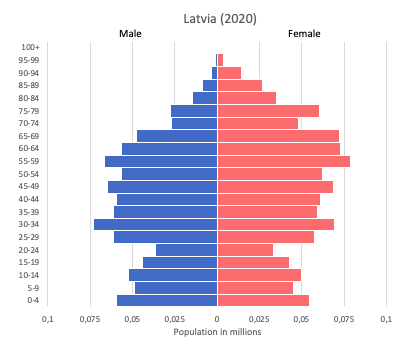
Age structure data
Estimate for 2020:
- 0-14 years: 15.32% (male 148,120/female 140,028)
- 15-24 years: 9% (male 87,372/female 81,965)
- 25-54 years: 40.41% (male 380,817/female 379,359)
- 55-64 years: 14.77% (male 125,401/female 152,548)
- 65 years and over: 20.5% (male 128,151/female 257,471)
Remark: the age structure of a population affects a nation’s key socioeconomic issues. Countries with young populations (high percentage under age 15) need to invest more in schools, while countries with older populations (high percentage ages 65 and over) need to invest more in the health sector. The age structure can also be used to help predict potential political issues. For example, the rapid growth of a young adult population unable to find employment can lead to unrest.
Population from 1950 to 2020
Source: United Nations, Department of Economic and Social Affairs, Population Division (2019). World Population Prospects 2019, Online Edition. Rev. 1.
Evolution of the life expectancy from 1960 to 2018
Source: World Development Indicators, The World Bank
Economy
Agriculture:
grain, rapeseed, potatoes, vegetables, pork, poultry, milk, eggs, fish
Industries:
processed foods, processed wood products, textiles, processed metals, pharmaceuticals, railroad cars, synthetic fibers, electronics
Exports – commodities:
foodstuffs, wood and wood products, metals, machinery and equipment, textiles
Imports – commodities:
machinery and equipment, consumer goods, chemicals, fuels, vehicles
Time zone and current time in Latvia
Go to our interactive map to get the current time in Latvia