Georgia
| Government | |
| Name | Georgia |
| Georgian | საქართველო Sakartvelo |
| Government type | Semi-presidential republic |
| Capital | Tbilisi 1,062,282 (2014)) |
| Currency | Georgian lari (GEL) |
| People | |
| Population (2020) | 3,989,175 (131st) |
| Density of population | 53.5 P/km2 (137th) |
| Nationality | Georgian |
| Official languages | |
| Georgian | |
| Abkhaz (in Abkhazia) | |
| Ethnic groups (2014) | |
| Georgian | 86.8% |
| Azeri | 6.3% |
| Armenian | 4.5% |
| Other | 2.3% |
| Religions (2014) | |
| Orthodox (official) | 83.4% |
| Muslim | 10.7% |
| Armenian Apostolic | 2.9% |
| Other | 1.2% |
| None | 0.5% |
| Unspecified / No answer | 1.2% |
| Life expectancy (2020) | |
| Male | 72.9 years |
| Female | 81.3 years |
| Total population | 77 years (85th) |
| Homicides | |
| Total (2018) | 2.2 per 100,000 people (102nd) |
| Geography | |
| Land area | 69,700 km2 |
| water area | 0 km2 |
| total area | 69,700 km2 (122th) |
| Note: around 12,560 km2 (about 18% of Georgia’s area) is occupied by Russia | |
| Mean elevation | 1,432 m |
| Lowest point | |
| Black Sea | 0 m |
| Highest point | |
| Mt’a Shkhara | 5,193 m |
| Land use (2011) | |
| Agricultural land | 35.5% |
| Arable land | 5.8% |
| Permanent crops | 1.8% |
| Permanent pasture | 27.9% |
| Forest | 39.4% |
| Other | 25.1% |
| Urbanization | |
| Urban population (2020) | 59.5% |
| Rate of urbanization | 0.42% annual rate of change (2015 – 2020) |
| Economy | |
| Labor force (2016) | 1.998 million (125th) |
| Labor force by occupation (2006) | |
| Agriculture | 55.6% |
| Industry | 8.9% |
| Services | 35.5% |
| Unemployment rate (2016) | 11.8% (156th) |
| GDP (PPP) (estimate 2019) | |
| Total | $46.05 billion (112th) |
| Per capita | $12,409(101st) |
| GDP (nominal) (estimate 2019) | |
| Total | $17.83 billion (118th) |
| Per capita | $4,285 (107th) |
| GDP by sector (estimate 2017) | |
| Agriculture | 8.2% |
| Industry | 23.7% |
| Services | 67.9% |
| Exports (2017) | $3.566 billion (121st) |
| Exports partners (2017) | |
| Russia | 14.5% |
| Azerbaijan | 10% |
| Turkey | 7.9% |
| Armenia | 7.7% |
| China | 7.6 |
| Bulgaria | 6.6% |
| Ukraine | 4.6% |
| US | 4.5% |
| Imports (2017) | $7.415 billion (114th) |
| Imports partners (2017) | |
| Turkey | 17.2% |
| Russia | 9.9% |
| China | 9.2% |
| Azerbaijan | 7.6% |
| Ukraine | 5.6% |
| Germany | 5.4% |
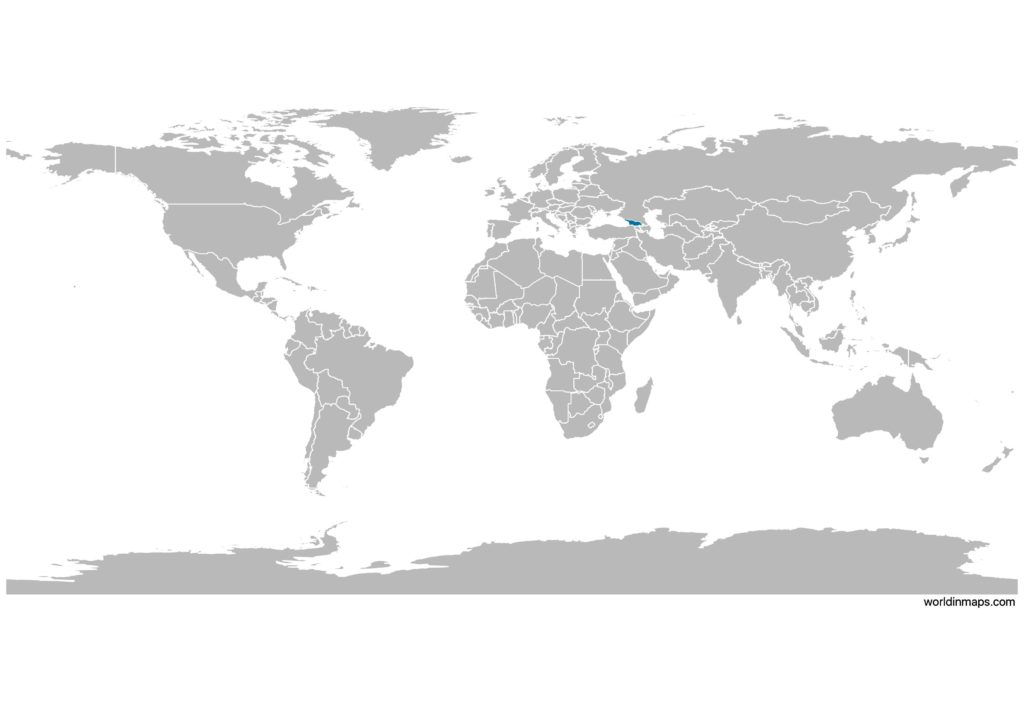
Georgia on the world map
Georgia top 10 largest cities (2014)
- Tbilisi (1,062,282)
- Batumi (152,839)
- Kutaisi (147,635)
- Rustavi (125,103)
- Gori (48,143)
- Zugdidi (42,998)
- Poti (41,465)
- Khashuri (26,135)
- Samtredia (25,318)
- Senaki (21,596)
Demography
Population pyramid
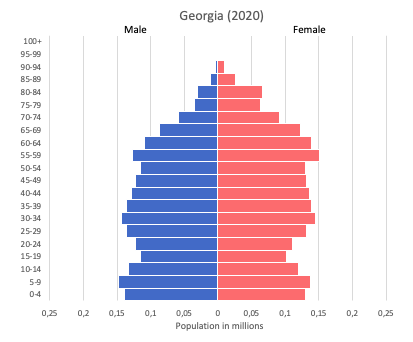
Age structure data
Estimate for 2020:
- 0-14 years: 18.42% (male 472,731/female 435,174)
- 15-24 years: 10.9% (male 286,518/female 250,882)
- 25-54 years: 40.59% (male 984,942/female 1,016,353)
- 55-64 years: 13.24% (male 288,650/female 364,117)
- 65 years and over: 16.85% (male 326,219/female 504,444)
Remark: the age structure of a population affects a nation’s key socioeconomic issues. Countries with young populations (high percentage under age 15) need to invest more in schools, while countries with older populations (high percentage ages 65 and over) need to invest more in the health sector. The age structure can also be used to help predict potential political issues. For example, the rapid growth of a young adult population unable to find employment can lead to unrest.
Population from 1950 to 2020
Source: United Nations, Department of Economic and Social Affairs, Population Division (2019). World Population Prospects 2019, Online Edition. Rev. 1.
Evolution of the life expectancy from 1960 to 2018
Source: World Development Indicators, The World Bank
Economy
Agriculture:
citrus, grapes, tea, hazelnuts, vegetables, livestock
Industries:
steel, machine tools, electrical appliances, mining (manganese, copper, gold), chemicals, wood products, wine
Exports – commodities:
vehicles, ferro-alloys, fertilizers, nuts, scrap metal, gold, copper ores
Imports – commodities:
fuels, vehicles, machinery and parts, grain and other foods, pharmaceuticals
Time zone and current time in Georgia
Go to our interactive map to get the current time in Georgia