Armenia
| Government | |
| Name | Republic of Armenia |
| Armenian | Հայաստանի Հանրապետություն Hayastani Hanrapetut’yun |
| Government type | Parliamentary democracy |
| Capital | Yerevan (1,075,800 (2017)) |
| Currency | Dram (AMD) |
| Organization | |
| Member State | Commonwealth of Independent States (CIS) |
| People | |
| Population (2020) | 2,963,234 (137th) |
| Density of population | 101.5 P/km2 (99th) |
| Nationality | Armenian |
| Official languages | |
| Armenian | |
| Ethnic groups (2011) | |
| Armenian | 98.1% |
| Yezidi (Kurd) | 1.2% |
| Other | 0.7% |
| Religion | |
| Armenian Apostolic | 92.6% |
| Evangelical | 1% |
| Other | 2.4% |
| None | 1.1% |
| Unspecified | 2.9% |
| Life expectancy (2020) | |
| Male | 72.3 years |
| Female | 79.2 years |
| Total population | 75.6 years (111st) |
| Homicides | |
| Total (2018) | 1.7 per 100,000 people (113th) |
| Literacy | |
| Definition: age 15 and over can read and write | |
| Male | 99.8% |
| Female | 99.7% |
| Total population | 99.7% |
| Geography | |
| Land area | 28,203 km2 |
| water area | 1,540 km2 |
| total area | 19,743 km2 (143rd) |
| Mean elevation | 1,792 m |
| Lowest point | |
| Debed River | 400 m |
| Highest point | |
| Aragats Lerrnagagat | 4,090 m |
| Land use (2016) | |
| Agricultural land | 59.7% |
| Arable land | 15.8% |
| Permanent crops | 1.9% |
| Permanent pasture | 42% |
| Forest | 9.1% |
| Other | 31.2% |
| Urbanization | |
| Urban population (2020) | 63.3% |
| Rate of urbanization | 0.22% annual rate of change (2015 – 2020) |
| Economy | |
| Labor force (2017) | 1.507 million (131st) |
| Agriculture | 36.3% |
| Industry | 17% |
| Services | 46.7% |
| Unemployment rate (2017) | 18.9% (183rd) |
| GDP (PPP) (estimate 2019) | |
| Total | $32.893 billion |
| Per capita | $10,995 |
| GDP (nominal) (estimate 2019) | |
| Total | $13.444 billion (127th) |
| Per capita | $4,527 (104th) |
| GDP by sector (estimate 2017) | |
| Agriculture | 16.7% |
| Industrie | 28.2% |
| Services | 54.8% |
| Exports (2017) | $2.361 billion (134th) |
| Exports partners (2017) | |
| Russia | 24.2% |
| Bulgaria | 12.8% |
| Switzerland | 12% |
| Georgia | 6.9% |
| Germany | 5.9% |
| China | 5.5% |
| Iraq | 5.4% |
| UAE | 4.6% |
| Netherlands | 4.1% |
| Imports (2017) | $3.771 billion (113th) |
| Imports partners (2017) | |
| Russia | 28% |
| China | 11.5% |
| Turkey | 5.5% |
| Germany | 4.9% |
| Iran | 4.3% |
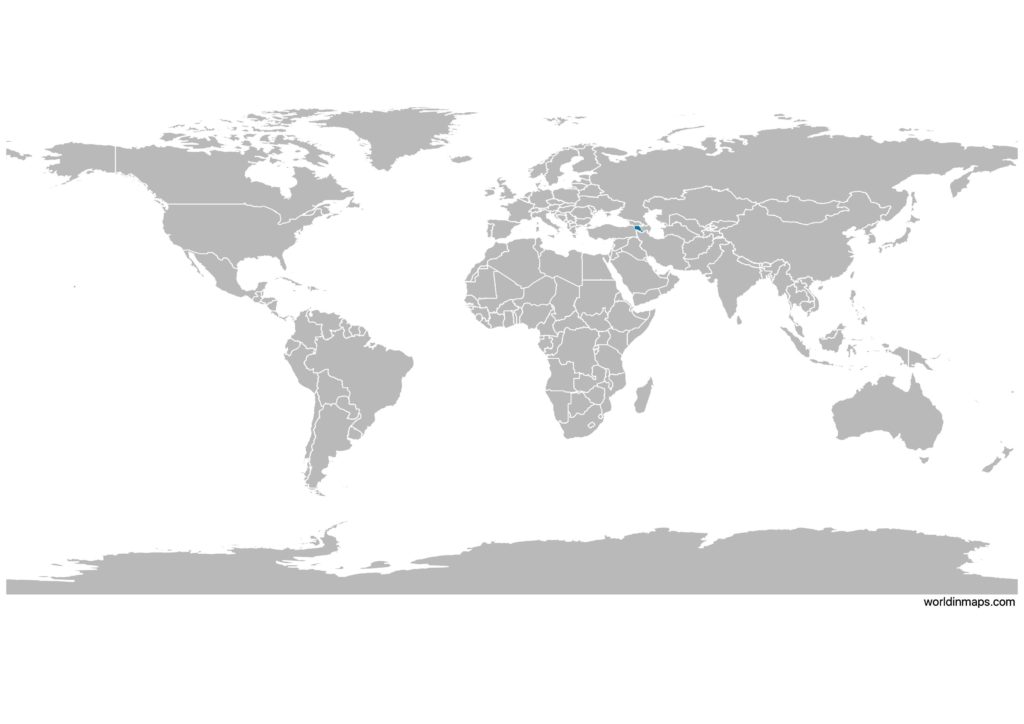
Armenia on the world map
Armenia top 10 largest cities (2011)
- Yerevan (1,060,138)
- Gyumri (121,976)
- Vanadzor (86,199)
- Vagharshapat (46,540)
- Abovyan (43,495)
- Kapan (43,190)
- Hrazdan (41,875)
- Armavir (29,319)
- Artashat (22,269)
- ljevan (21,081)
Demography
Population pyramid
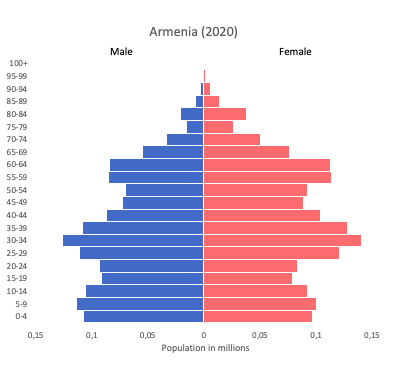
Age structure data
Estimate for 2020:
- 0-14 years: 18.64% (male 297,320/female 265,969)
- 15-24 years: 11.63% (male 184,258/female 167,197)
- 25-54 years: 43.04% (male 639,101/female 661,421)
- 55-64 years: 14.08% (male 195,754/female 229,580)
- 65 years and over: 12.6% (male 154,117/female 226,607)
Population from 1950 to 2020
Source: United Nations, Department of Economic and Social Affairs, Population Division (2019). World Population Prospects 2019, Online Edition. Rev. 1.
Evolution of the life expectancy from 1960 to 2018
Source: World Development Indicators, The World Bank
Economy
Agriculture:
fruit (especially grapes and apricots), vegetables, livestock
Industries:
brandy, mining, diamond processing, metal-cutting machine tools, forging and pressing machines, electric motors, knitted wear, hosiery, shoes, silk fabric, chemicals, trucks, instruments, microelectronics, jewelry, software, food processing
Exports – commodities:
unwrought copper, pig iron, nonferrous metals, gold, diamonds, mineral products, foodstuffs, brandy, cigarettes, energy
Imports – commodities:
natural gas, petroleum, tobacco products, foodstuffs, diamonds, pharmaceuticals, cars
Time zone and current time in Armenia
Go to our interactive map to get the current time in Armenia