Guinea-Bissau
| Government | |
| Name | Republic of Guinea-Bissau |
| Portuguese | República da Guiné-Bissau |
| Government type | Semi-presidential republic |
| Capital | Bissau 492,004 (2015)) |
| Currency | West African CFA franc (XOF) |
| People | |
| Population (2020) | 1,967,998 (152nd) |
| Density of population | 46.9 P/km2 (154th) |
| Nationality | Bissau-Guinean |
| Official languages | |
| Portuguese | |
| Ethnic groups (2008) | |
| Fulani | 28.5% |
| Balanta | 22.5% |
| Mandinga | 14.7% |
| Papel | 9.1% |
| Manjaco | 8.3% |
| Beafada | 3.5% |
| Mancanha | 3.1% |
| Bijago | 2.1% |
| Felupe | 1.7% |
| Mansoanca | 1.4% |
| Balanta Mane | 1% |
| Other | 1.8% |
| None | 2.2% |
| Religions (2008) | |
| Muslim | 45.1% |
| Christian | 22.1% |
| Animist | 14.9% |
| None | 2% |
| Unspecified | 15.9% |
| Life expectancy (2020) | |
| Male | 60.6 years |
| Female | 65.1 years |
| Total population | 62.8 years (207th) |
| Homicides | |
| Total (2017) | 1.1 per 100,000 people (135th) |
| Geography | |
| Land area | 28,120 km2 |
| water area | 8,005 km2 |
| total area | 36,125 km2 (138th) |
| Mean elevation | 70 m |
| Lowest point | |
| Atlantic Ocean | 0 m |
| Highest point | |
| Unnamed elevation in the eastern part of the country | 300 m |
| Land use (2011) | |
| Agricultural land | 44.8% |
| Arable land | 8.2% |
| Permanent crops | 6.9% |
| Permanent pasture | 29.7% |
| Forest | 55.2% |
| Other | 0% |
| Urbanization | |
| Urban population (2020) | 44.2% |
| Rate of urbanization | 3.41% annual rate of change (2015 – 2020) |
| Economy | |
| Labor force (2013) | 731,300 million (151st) |
| Labor force by occupation (2000) | |
| Agriculture | 82% |
| Industry and services | 18% |
| Unemployment rate | NA |
| GDP (PPP) (estimate 2018) | |
| Total | $3.391 billion |
| Per capita | $1,951 |
| GDP (nominal) (estimate 2018) | |
| Total | $1.480 billion |
| Per capita | $851 |
| GDP by sector (estimate 2017) | |
| Agriculture | 50% |
| Industry | 13.1% |
| Services | 36.9% |
| Exports (2017) | $328.1 million (184th) |
| Exports partners (2017) | |
| India | 67.1% |
| Vietnam | 21.1% |
| Imports (2017) | $283.5 million (206th) |
| Imports partners (2017) | |
| Portugal | 47.8% |
| Senegal | 12.1% |
| China | 10.4% |
| Netherlands | 8.1% |
| Pakistan | 5.4% |
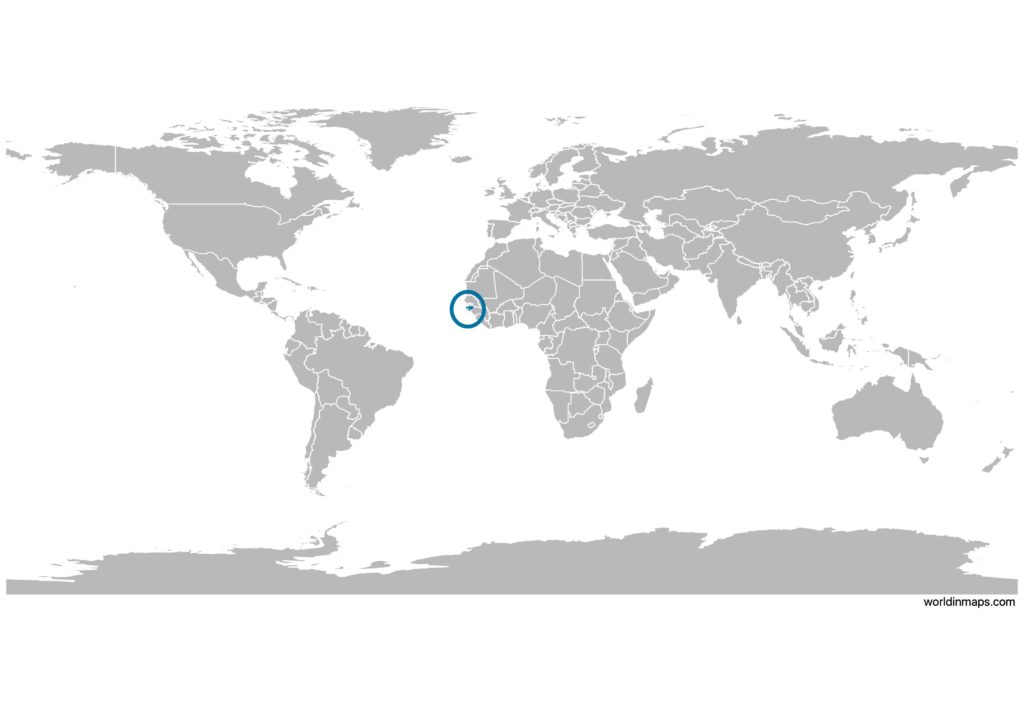
Guinea-Bissau on the world map
Guinea-Bissau top 10 largest cities (2015)
- Bissau (492,004)
- Gabu (48,670)
- Bafatá (37,985)
- Bissorã (29,468)
- Bolama (16,216)
- Cacheu (14,320)
- Bubaque (12,922)
- Catió (11,498)
- Mansôa (9,198)
- Buba (8,993)
Demography
Population pyramid
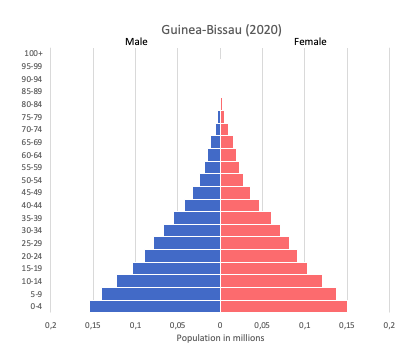
Age structure data
Estimate for 2020:
- 0-14 years: 43.17% (male 417,810/female 414,105)
- 15-24 years: 20.38% (male 192,451/female 200,370)
- 25-54 years: 30.24% (male 275,416/female 307,387)
- 55-64 years: 3.12% (male 29,549/female 30,661)
- 65 years and over: 3.08% (male 25,291/female 34,064)
Remark: the age structure of a population affects a nation’s key socioeconomic issues. Countries with young populations (high percentage under age 15) need to invest more in schools, while countries with older populations (high percentage ages 65 and over) need to invest more in the health sector. The age structure can also be used to help predict potential political issues. For example, the rapid growth of a young adult population unable to find employment can lead to unrest.
Population from 1950 to 2020
Source: United Nations, Department of Economic and Social Affairs, Population Division (2019). World Population Prospects 2019, Online Edition. Rev. 1.
Evolution of the life expectancy from 1960 to 2018
Source: World Development Indicators, The World Bank
Economy
Agriculture:
rice, corn, beans, cassava (manioc, tapioca), cashew nuts, peanuts, palm kernels, cotton, timber, fish
Industries:
agricultural products processing, beer, soft drinks
Exports – commodities:
fish, shrimp, cashews, peanuts, palm kernels, raw and sawn lumber
Imports – commodities:
foodstuffs, machinery and transport equipment, petroleum products
Time zone and current time in Guinea-Bissau
Go to our interactive map to get the current time in Guinea-Bissau