Senegal
| Government | |
| Name | Republic of Senegal |
| Wolof | Réewum Senegal |
| Fula | Renndaandi Senegal |
| French | République du Sénégal |
| Government type | presidential republic |
| Capital | Dakar (2,646,503 (2013)) |
| Currency | West African CFA franc (XOF) |
| People | |
| Population (2020) | 16,743,930 (72nd) |
| Density of population | 68.7 P/km2 (134th) |
| Nationality | Senegalese |
| Official languages | |
| French | |
| Ethnic groups (2017) | |
| Wolof | 37.1% |
| Pular | 26.2% |
| Serer | 17% |
| Mandinka | 5.6% |
| Jola | 4.5% |
| Soninke | 1.4% |
| Other | 8.3% |
| Religions (2016) | |
| Muslim | 95.9% |
| Christian | 4.1% |
| Life expectancy (2020) | |
| Male | 61.1 years |
| Female | 65.4 years |
| Total population | 63.2 years (206th) |
| Homicides | |
| Total (2015) | 0.3 per 100,000 people (171st) |
| Geography | |
| Land area | 192,530 km2 |
| water area | 4,192 km2 |
| total area | 196,722 km2 (89th) |
| Mean elevation | 69 m |
| Lowest point | |
| Atlantic Ocean | 0 m |
| Highest point | |
| Unnamed elevation 2.8 km southeast of Nepen Diaka | 648 m |
| Land use (2011) | |
| Agricultural land | 46.8% |
| Arable land | 17.4% |
| Permanent crops | 0.3% |
| Permanent pasture | 29.1% |
| Forest | 43.8% |
| Other | 9.4% |
| Urbanization | |
| Urban population (2020) | 48.1% |
| Rate of urbanization | 3.73% annual rate of change (2015 – 2020) |
| Economy | |
| Labor force (2017) | 6.966 million (67th) |
| Labor force by occupation (2007) | |
| Agriculture | 77.5% |
| Industry and services | 22.5% |
| Unemployment rate (2007) | 48% (216th) |
| GDP (PPP) (estimate 2020) | |
| Total | $66.438 billion (99th) |
| Per capita | $3,675(158th) |
| GDP (nominal) (estimate 2020) | |
| Total | $28.02 billion (105th) |
| Per capita | $1,675 (149th) |
| GDP by sector (estimate 2017) | |
| Agriculture | 16.9% |
| Industry | 24.3% |
| Services | 58.8% |
| Exports (2017) | $2.362 billion (133rd) |
| Exports partners (2017) | |
| Mali | 14.8% |
| Switzerland | 11.4% |
| India | 6% |
| Cote d’Ivoire | 5.3% |
| UAE | 5.1% |
| Gambia | 4.2% |
| Spain | 4.1% |
| Imports (2017) | $5.217 billion (125th) |
| Imports partners (2017) | |
| France | 16.3% |
| China | 10.4% |
| Nigeria | 8% |
| India | 7.2% |
| Netherlands | 4.8% |
| Spain | 4.2% |
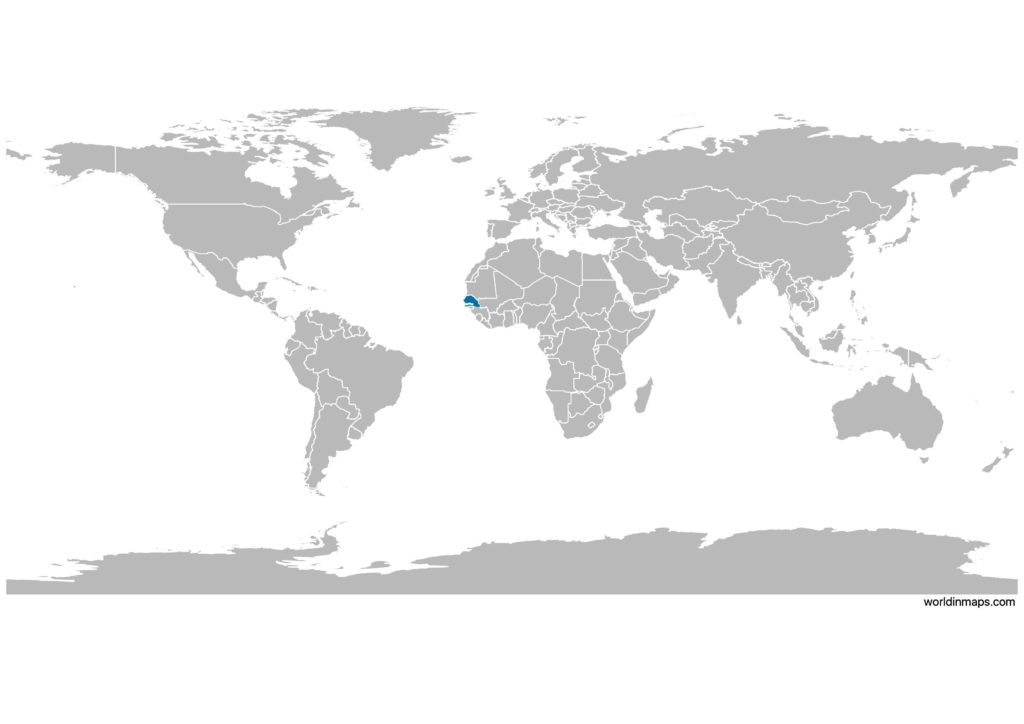
Senegal on the world map
Senegal top 10 largest cities (2013)
- Dakar (2,646,503)
- Touba (753,315)
- Thiès (317,763)
- Kaolack (233,708)
- M’Bour (232,777)
- Rufisque (221,066)
- Ziguinchor (205,294)
- Diourbel (133,705)
- Tambacounda (107,293)
- Louga (104,349)
Demography
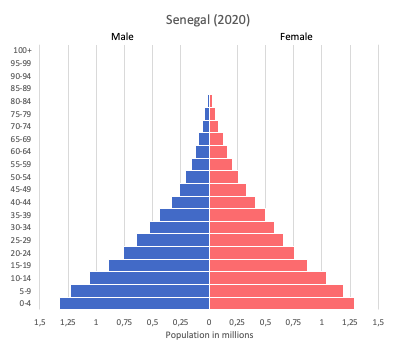
Population pyramid
Age structure data
Estimate for 2020:
- 0-14 years: 40.38% (male 3,194,454/female 3,160,111)
- 15-24 years: 20.35% (male 1,596,896/female 1,606,084)
- 25-54 years: 31.95% (male 2,327,424/female 2,700,698)
- 55-64 years: 4.21% (male 283,480/female 378,932)
- 65 years and over: 3.1% (male 212,332/female 275,957)
Remark: the age structure of a population affects a nation’s key socioeconomic issues. Countries with young populations (high percentage under age 15) need to invest more in schools, while countries with older populations (high percentage ages 65 and over) need to invest more in the health sector. The age structure can also be used to help predict potential political issues. For example, the rapid growth of a young adult population unable to find employment can lead to unrest.
Population from 1950 to 2020
Source: United Nations, Department of Economic and Social Affairs, Population Division (2019). World Population Prospects 2019, Online Edition. Rev. 1.
Evolution of the life expectancy from 1960 to 2018
Source: World Development Indicators, The World Bank
Economy
Agriculture:
peanuts, millet, corn, sorghum, rice, cotton, tomatoes, green vegetables, cattle, poultry, pigs, fish
Industries:
agricultural and fish processing, phosphate mining, fertilizer production, petroleum refining, zircon, and gold mining, construction materials, ship construction and repair
Exports – commodities:
fish, groundnuts (peanuts), petroleum products, phosphates, cotton
Imports – commodities:
food and beverages, capital goods, fuels
Time zone and current time in Senegal
Go to our interactive map to get the current time in Senegal