Suriname
| Government | |
| Name | Republic of Suriname |
| Dutch | Republiek Suriname |
| Government type | presidential republic |
| Capital | Paramaribo (223,757) |
| Currency | Surinamese dollar (SRD) |
| People | |
| Population (2020) | 586,634 (171st) |
| Density of population | 2.9 P/km2 (231st) |
| Nationality | Surinamese |
| Official languages | |
| Dutch | |
| Ethnic groups (2012) | |
| Hindustani (also known locally as “East Indians”; their ancestors emigrated from northern India in the latter part of the 19th century) | 27.4% |
| Maroon (African ancestors were brought to the country in the 17th and 18th centuries as slaves and escaped to the interior) | 21.7% |
| Creole (mixed white and black) | 15.7% |
| Javanese | 13.7% |
| mixed | 13.4% |
| other | 7.6% |
| unspecified | 0.6% |
| Religions (2012) | |
| Protestant | 23.6% |
| Evangelical | 11.2% |
| Moravian | 11.2% |
| Reformed | 0.7% |
| Lutheran | 0.5% |
| Hindu | 22.3% |
| Roman Catholic | 21.6% |
| Muslim | 13.8% |
| other Christian | 3.2% |
| Winti | 1.8% |
| Jehovah’s Witness | 1.2% |
| other | 1.7% |
| none | 7.5% |
| unspecified | 3.2% |
| Life expectancy (2020) | |
| Male | 70.8 years |
| Female | 75.9 years |
| Total population | 73.3 years (148th) |
| Homicides | |
| Total (2017) | 5.4 per 100,000 people (57th) |
| Geography | |
| Land area | 156,000 km2 |
| water area | 7,820 km2 |
| total area | 163,820 km2 (93rd) |
| Mean elevation | 246 m |
| Lowest point | |
| unnamed location in the coastal plain | -2 m |
| Highest point | |
| Juliana Top | 1,230 m |
| Land use (2011) | |
| Agricultural land | 0.5% |
| Arable land | 0.4% |
| Permanent crops | 0% |
| Permanent pasture | 0.1% |
| Forest | 94.6% |
| Other | 4.9% |
| Urbanization | |
| Urban population (2020) | 66.1% |
| Rate of urbanization | 0.9% annual rate of change (2015 – 2020) |
| Economy | |
| Labor force (2014) | 144,000 (177th) |
| Labor force by occupation (2010) | |
| Agriculture | 11.2% |
| Industry | 19.5% |
| Services | 69.3% |
| Unemployment rate (2017) | 8.9% (129th) |
| GDP (PPP) (estimate 2019) | |
| Total | $9.044 billion |
| Per capita | $15,845 |
| GDP (nominal) (estimate 2019) | |
| Total | $4.110 billion |
| Per capita | $6,881 |
| GDP by sector (estimate 2017) | |
| Agriculture | 11.6% |
| Industry | 31.1% |
| Services | 57.4% |
| Exports (2017) | $2.028 billion (139th) |
| Exports partners (2017) | |
| Switzerland | 38% |
| Hong Kong | 21.9% |
| Belgium | 10.1% |
| UAE | 7.2% |
| Guyana | 6.1% |
| Imports (2017) | $1.293 billion (177th) |
| Imports partners (2017) | |
| US | 30.6% |
| Netherlands | 14.8% |
| Trinidad and Tobago | 11.4% |
| China | 7.6% |
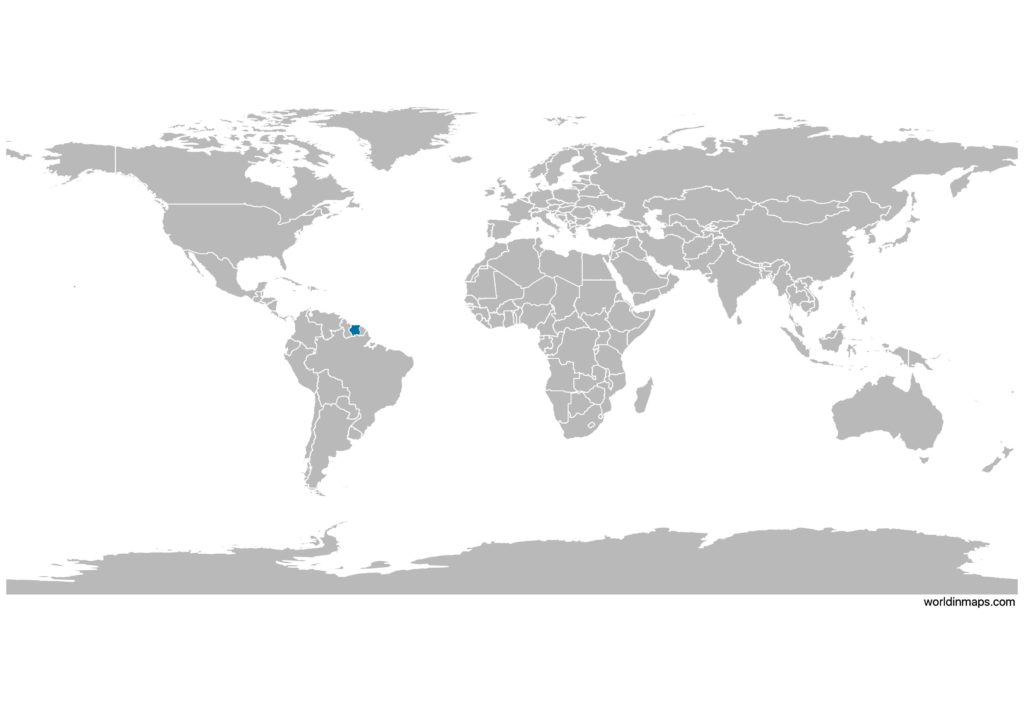
Suriname on the world map
Suriname top 10 largest cities
- Paramaribo (223,757)
- Lelydorp (18,223)
- Brokopondo (14,662)
- Nieuw Nickerie (13,143)
- Moengo (7,074)
- Nieuw Amsterdam (4,935)
- Mariënburg (4,427)
- Wageningen (4,145)
- Albina (3,985)
- Groningen (3,216)
Demography
Population pyramid
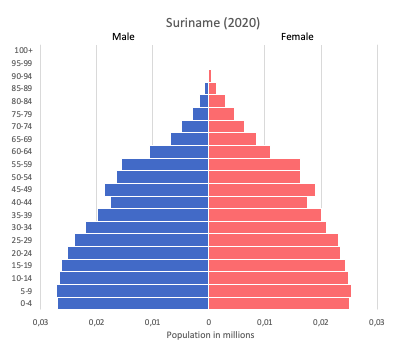
Age structure data
Estimate for 2020:
- 0-14 years: 23.38% (male 72,642/female 69,899)
- 15-24 years: 17.2% (male 53,427/female 51,438)
- 25-54 years: 44.09% (male 136,889/female 131,868)
- 55-64 years: 8.78% (male 26,435/female 27,066)
- 65 years and over: 6.55% (male 17,437/female 22,468)
Remark: the age structure of a population affects a nation’s key socioeconomic issues. Countries with young populations (high percentage under age 15) need to invest more in schools, while countries with older populations (high percentage ages 65 and over) need to invest more in the health sector. The age structure can also be used to help predict potential political issues. For example, the rapid growth of a young adult population unable to find employment can lead to unrest.
Population from 1950 to 2020
Source: United Nations, Department of Economic and Social Affairs, Population Division (2019). World Population Prospects 2019, Online Edition. Rev. 1.
Evolution of the life expectancy from 1960 to 2018
Source: World Development Indicators, The World Bank
Economy
Agriculture:
rice, bananas, seabob shrimp, yellow-fin tuna, vegetables
Industries:
gold mining, oil, lumber, food processing, fishing
Exports – commodities:
alumina, gold, crude oil, lumber, shrimp and fish, rice, bananas
Imports – commodities:
capital equipment, petroleum, foodstuffs, cotton, consumer goods
Time zone and current time in Suriname
Go to our interactive map to get the current time in Suriname