Serbia
| Government | |
| Name | Republic of Serbia |
| Serbian | Република Србија Republika Srbija |
| Government type | parliamentary republic |
| Capital | Belgrade (1,659,440 (2011)) |
| Currency | Serbian dinar (RSD) |
| People | |
| Population (2020) | 8,737,370 (including Kosovo) |
| Density of population | 89 P/km2 (95th) |
| Nationality | Serb |
| Official languages | |
| Serbian | |
| Ethnic groups (2011) | |
| Serb | 83.3% |
| Hungarian | 3.5% |
| Romani | 2.1% |
| Bosniak | 2% |
| Other | 9.1% |
| Religions (2011) | |
| Orthodox | 84.6% |
| Catholic | 5% |
| Muslim | 3.1% |
| Protestant | 1% |
| atheist | 1.1% |
| other | 5.3% |
| Life expectancy (2020) | |
| Male | 73.4 years |
| Female | 79.4 years |
| Total population | 76.3 years (99th) |
| Homicides | |
| Total (2018) | 1.2 per 100,000 people (129th) |
| Geography | |
| Land area | 77,474 km2 |
| water area | 0 km2 |
| total area | 77,474 km2 (118th) |
| Mean elevation | 442 m |
| Lowest point | |
| Danube and Timok Rivers | 35 m |
| Highest point | |
| Midzor | 2,169 m |
| Land use (2011) | |
| Agricultural land | 57.9% |
| Arable land | 37.7% |
| Permanent crops | 3.4% |
| Permanent pasture | 16.8% |
| Forest | 31.6% |
| Other | 10.5% |
| Urbanization | |
| Urban population (2020) | 56.4% |
| Rate of urbanization | -0.07% annual rate of change (2015 – 2020) |
| Economy | |
| Labor force (2017) | 2.92 million (106th) |
| Labor force by occupation (2017) | |
| Agriculture | 19.4% |
| Industry | 24.5% |
| Services | 56.1% |
| Unemployment rate (2017) | 14.1% (170th) |
| GDP (PPP) (estimate 2020) | |
| Total | $137.126 billion (75th) |
| Per capita | $19,767 (excluding Kosovo)(67th) |
| GDP (nominal) (estimate 2020) | |
| Total | $55.437 billion (81st) |
| Per capita | $7,992 (excluding Kosovo) (76th) |
| GDP by sector (estimate 2017) | |
| Agriculture | 9.8% |
| Industry | 41.1% |
| Services | 49.1% |
| Exports (2017) | $15.92 billion (73rd) |
| Exports partners (2017) | |
| Italy | 13.5% |
| Germany | 12.8% |
| Bosnia and Herzegovina | 8.2% |
| Russia | 6% |
| Romania | 4.9% |
| Imports (2017) | $20.44 billion (76th) |
| Imports partners (2017) | |
| Germany | 12.7% |
| Italy | 10% |
| China | 8.2% |
| Russia | 7.3% |
| Hungary | 4.9% |
| Poland | 4.1% |
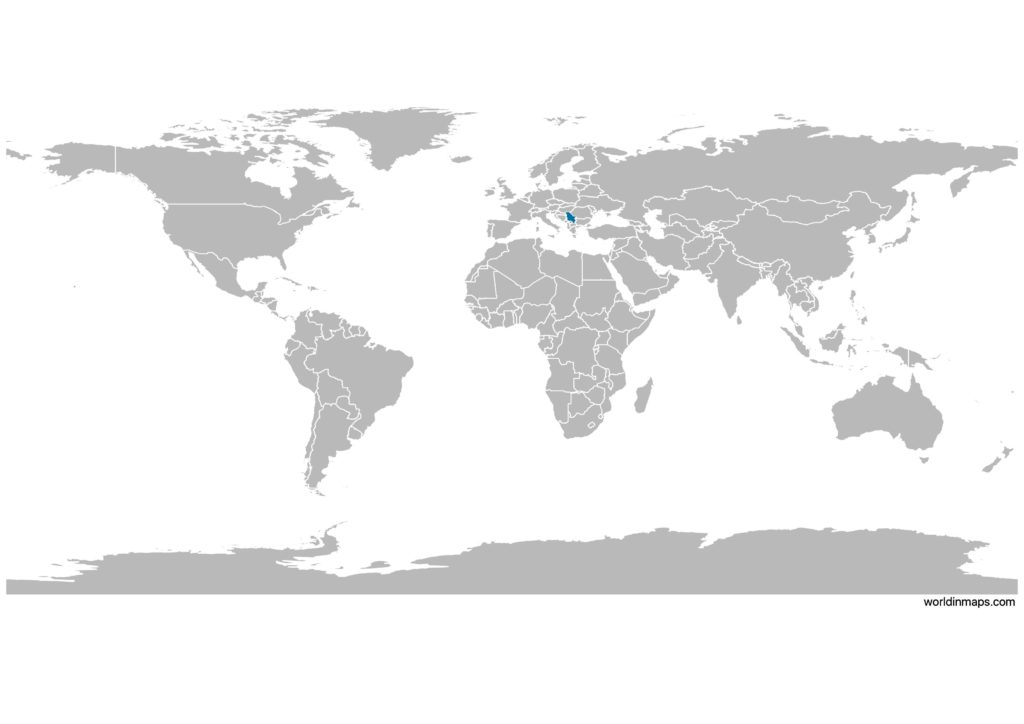
Serbia on the world map
Serbia top 10 largest cities (2011)
- Belgrade (1,659,440)
- Novi Sad (341,625)
- Niš (260,237)
- Kragujevac (179,417)
- Leskovac (144,206)
- Subotica (141,554)
- Kruševac (128,752)
- Kraljevo (125,448)
- Pančevo (123,414)
- Zrenjanin (123,362)
Demography
Population pyramid
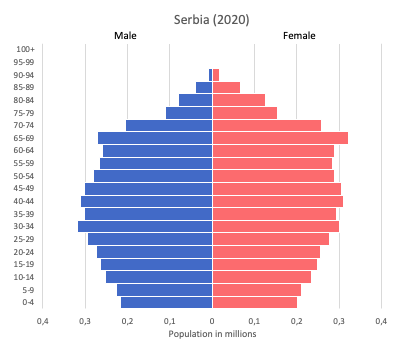
Age structure data
Estimate for 2020:
- 0-14 years: 14.07% (male 508,242/female 478,247)
- 15-24 years: 11.04% (male 399,435/female 374,718)
- 25-54 years: 41.19% (male 1,459,413/female 1,429,176)
- 55-64 years: 13.7% (male 464,881/female 495,663)
- 65 years and over: 20% (male 585,705/female 816,685)
Remark: the age structure of a population affects a nation’s key socioeconomic issues. Countries with young populations (high percentage under age 15) need to invest more in schools, while countries with older populations (high percentage ages 65 and over) need to invest more in the health sector. The age structure can also be used to help predict potential political issues. For example, the rapid growth of a young adult population unable to find employment can lead to unrest.
Population from 1950 to 2020
Source: United Nations, Department of Economic and Social Affairs, Population Division (2019). World Population Prospects 2019, Online Edition. Rev. 1.
Economy
Agriculture:
wheat, maize, sunflower, sugar beets, grapes/wine, fruits (raspberries, apples, sour cherries), vegetables (tomatoes, peppers, potatoes), beef, pork, and meat products, milk and dairy products
Industries:
automobiles, base metals, furniture, food processing, machinery, chemicals, sugar, tires, clothes, pharmaceuticals
Exports – commodities:
automobiles, iron and steel, rubber, clothes, wheat, fruit and vegetables, nonferrous metals, electric appliances, metal products, weapons and ammunition
Imports – commodities:
machinery and transport equipment, fuels and lubricants, manufactured goods, chemicals, food and live animals, raw materials
Time zone and current time in Serbia
Go to our interactive map to get the current time in Serbia