Bosnia and Herzegovina
| Government | |
| Name | Bosnia and Herzegovina |
| Bosnian | Bosna i Hercegovina |
| Serbian | Босна и Херцеговина |
| Government type | Parliamentary republic |
| Capital | Sarajevo (356,454 (2013)) |
| Currency | Convertible mark (BAM) |
| People | |
| Population (2020) | 3,280,815 (135th) |
| Density of population | 69 P/km2 |
| Nationality | Bosnian, Herzegovinian |
| Official languages (2013) | |
| Bosnian | 52.9% |
| Serbian | 30.8% |
| Coratian | 14.6% |
| Ethnic groups (2013) | |
| Bosniak | 50.1% |
| Serb | 30.8% |
| Croat | 15.4% |
| Other | 2.7% |
| not declared / no answer | 1% |
| Religions (2013) | |
| Muslim | 50.7% |
| Orthodox | 30.7% |
| Roman Catholic | 15.2% |
| Atheist | 0.8% |
| Agnostic | 0.3% |
| Other | 1.2% |
| Undeclared / no answer | 1.1% |
| Life expectancy (2020) | |
| Male | 74.5 years |
| Female | 80.7 years |
| Total population | 77.5 years (79th) |
| Homicides | |
| Total (2018) | 1.2 per 100,000 people (134th) |
| Geography | |
| Land area | 51,187 km2 |
| water area | 10 km2 |
| total area | 51,197 km2 (129th) |
| Mean elevation | 500 m |
| Lowest point | |
| Adriatic | 0 m |
| Highest point | |
| Maglic | 2,386 m |
| Land use (2011) | |
| Agricultural land | 42.2% |
| Arable land | 19.7% |
| Permanent crops | 2% |
| Permanent pasture | 20.5% |
| Forest | 42.8% |
| Other | 15% |
| Urbanization | |
| Urban population (2020) | 49% |
| Rate of urbanization | 0.55% annual rate of change (2015 – 2020) |
| Economy | |
| Labor force (2017) | 1.38 million (134th) |
| Labor force by occupation (2013) | |
| Agriculture | 18% |
| Industry | 30.4% |
| Services | 51.7% |
| Unemployment rate (2017) | 20.5% (188th) |
| GDP (PPP) (estimate 2020) | |
| Total | $52.103 billion |
| Per capita | $14,894 |
| GDP (nominal) (estimate 2020) | |
| Total | $21.023 billion |
| Per capita | $6,056 |
| GDP by sector (estimate 2017) | |
| Agriculture | 6.8% |
| Industry | 28.9% |
| Services | 64.3% |
| Exports (2017) | $5.205 billion (106th) |
| Exports partners (2017) | |
| Germany | 14.7% |
| Croatia | 11.8% |
| Italy | 11.1% |
| Serbia | 10% |
| Slovenia | 9% |
| Austria | 8.3% |
| Imports (2017) | $9.547 billion (102th) |
| Imports partners (2017) | |
| Germany | 11.6% |
| Italy | 11.3% |
| Serbia | 11.1% |
| Croatia | 10.1% |
| China | 6.5% |
| Slovenia | 5% |
| Russia | 4.7% |
| Turkey | 4.2% |
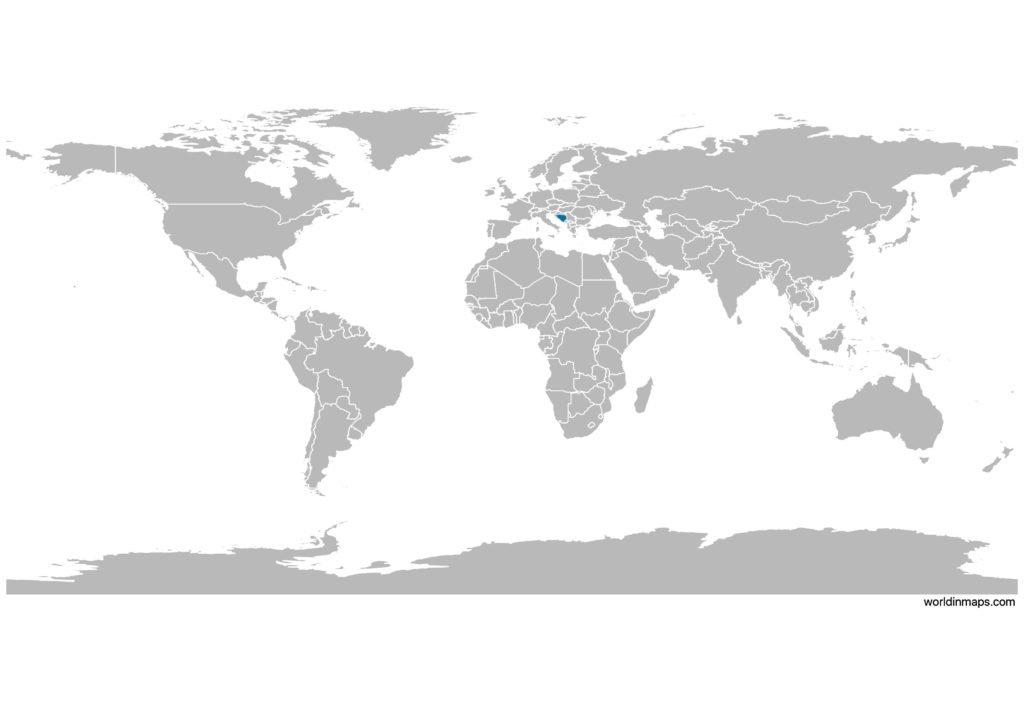
Bosnia and Herzegovina on the world map
Bosnia and Herzegovina top 10 largest cities (2013)
- Sarajevo (356,454)
- Banja Luka (185,042)
- Tuzla (110,979)
- Zenica (110,663)
- Bijeljina (107,715)
- Mostar (105,797)
- Prijedor (89,397)
- Brčko (83,516)
- Doboj (71,441)
- Cazin (66,149)
Demography
Population pyramid
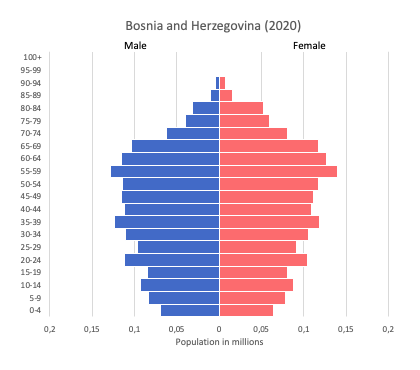
Age structure data
Estimate for 2020:
- 0-14 years: 13.18% (male 261,430/female 244,242)
- 15-24 years: 10.83% (male 214,319/female 201,214)
- 25-54 years: 44.52% (male 859,509/female 848,071)
- 55-64 years: 15.24% (male 284,415/female 300,168)
- 65 years and over: 16.22% (male 249,624/female 372,594)
Remark: the age structure of a population affects a nation’s key socioeconomic issues. Countries with young populations (high percentage under age 15) need to invest more in schools, while countries with older populations (high percentage ages 65 and over) need to invest more in the health sector. The age structure can also be used to help predict potential political issues. For example, the rapid growth of a young adult population unable to find employment can lead to unrest.
Population from 1950 to 2020
Source: United Nations, Department of Economic and Social Affairs, Population Division (2019). World Population Prospects 2019, Online Edition. Rev. 1.
Evolution of the life expectancy from 1960 to 2018
Source: World Development Indicators, The World Bank
Economy
Agriculture:
wheat, corn, fruits, vegetables, livestock
Industries:
steel, coal, iron ore, lead, zinc, manganese, bauxite, aluminum, motor vehicle assembly, textiles, tobacco products, wooden furniture, ammunition, domestic appliances, oil refining
Exports – commodities:
metals, clothing, wood products
Imports – commodities:
machinery and equipment, chemicals, fuels, foodstuffs
Time zone and current time in Bosnia and Herzegovina
Go to our interactive map to get the current time in Bosnia and Herzegovina