Belize
| Government | |
| Name | Commonwealth of Belize |
| Government type | Parliamentary democracy (National Assembly) under a constitutional monarchy (a Commonwealth realm) |
| Capital | Belmopan (20,621 (2016)) |
| Currency | Belize dollar (BZD) |
| Organization | |
| Member State | Commonwealth of Nations |
| People | |
| Population (2020) | 397,621 (176th) |
| Density of population | 17.2 P/km2 (213rd) |
| Nationality | Belizean |
| Official languages | |
| English | |
| Ethnic groups (2010)1 | |
| Mestizo | 52.9% |
| Creole | 25.9% |
| Maya | 11.3% |
| Garifuna | 6.1% |
| East Indian | 3.9% |
| Mennonite | 3.6% |
| European | 1.2% |
| Asian | 1% |
| Other | 1.2% |
| Unknown | 0.3% |
| Religions (2010) | |
| Roman Catholic | 40.1% |
| Protestant | 31.5% |
| Pentecostal | 8.4% |
| Seventh Day Adventist | 5.4% |
| Anglican | 4.7% |
| Mennonite | 3.7% |
| Baptist | 3.6% |
| Methodist | 2.9% |
| Nazarene | 2.8% |
| Jehovah’s Witness | 1.7% |
| Other (includes Baha’i, Buddhist, Hindu, Mormon, Muslim, Rastafarian, Salvation Army) | 10.5% |
| Unspecified | 0.6% |
| None | 15.5% |
| Life expectancy (2020) | |
| Male | 73.7 years |
| Female | 77 years |
| Total population | 75.3 years (117th) |
| Homicides | |
| Total (2017) | 37.8 per 100,000 people (5th) |
| Geography | |
| Land area | 22,806 km2 |
| water area | 180 km2 |
| total area | 22,966 km2 (152nd) |
| Mean elevation | 173 m |
| Lowest point | |
| Caribbean Sea | 0 m |
| Highest point | |
| Doyle’s Delight | 1,124 m |
| Land use (2011) | |
| Agricultural land | 6.9% |
| Arable land | 3.3% |
| Permanent crops | 1.4% |
| Permanent pasture | 2.2% |
| Forest | 60.6% |
| Other | 32.5% |
| Urbanization | |
| Urban population (2020) | 46% |
| Rate of urbanization | 2.32% annual rate of change (2015 – 2020) |
| Economy | |
| Labor force (2008) note: Shortage of skilled labor and all types of technical personnel | 120,500 million (180th) |
| Labor force by occupation (2007) | |
| Agriculture | 10.2% |
| Industry | 18.1% |
| Services | 71.7% |
| Unemployment rate (2017) | 9% (130th) |
| GDP (PPP) (estimate 2019) | |
| Total | $3.484 billion |
| Per capita | $8,576 |
| GDP (nominal) (estimate 2019) | |
| Total | $1.987 billion |
| Per capita | $4,890 (17th) |
| GDP by sector (estimate 2017) | |
| Agriculture | 10.3% |
| Industry | 21.6% |
| Services | 68% |
| Exports (2017) | $457.5 million (177th) |
| Exports partners (2017) | |
| UK | 33.9% |
| US | 22% |
| Jamaica | 6.7% |
| Italy | 6.4% |
| Barbados | 5.9% |
| Ireland | 5.5% |
| Netherlands | 4.3% |
| Imports (2017) | $845.9 million (188th) |
| Imports partners (2017) | |
| US | 35.6% |
| China | 11.2% |
| Mexico | 11.2% |
| Guatemala | 6.9% |
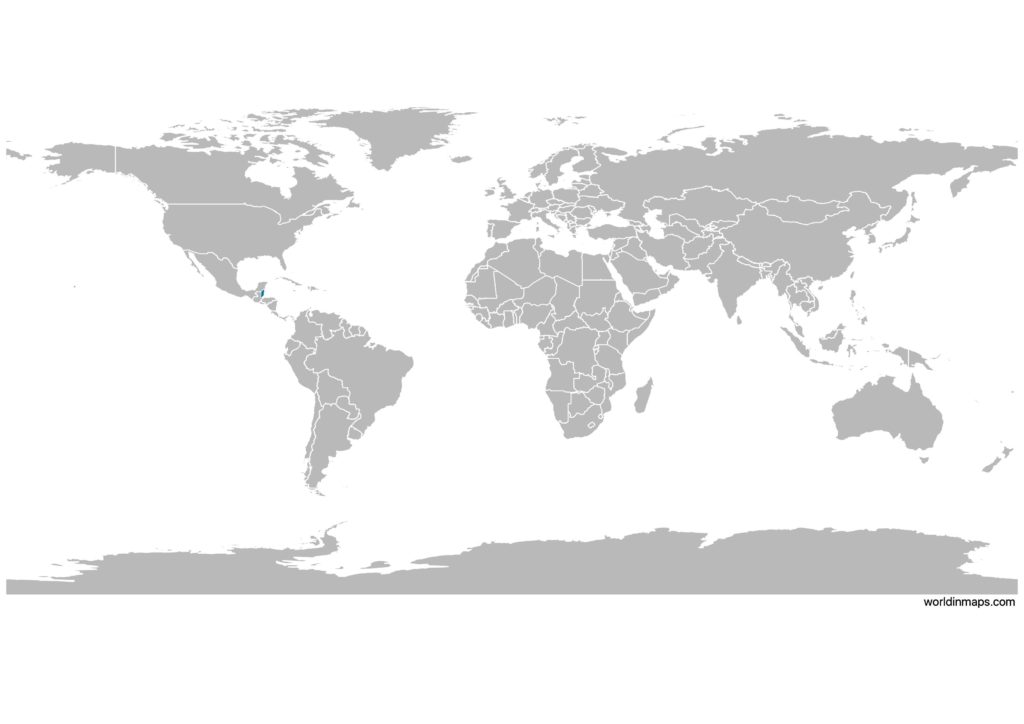
Belize on the world map
Belize top 10 largest cities (2010)
- Belize city (57,169)
- San Ignacio (17,878)
- Belmopan (13,939)
- Orange Walk Town (13,708)
- San Pedro Town (11,767)
- Corozal Town (10,287)
- Dangriga (9,593)
- Benque Viejo del Carmen (6,140)
- Ladyville (5,458)
- Punta Gorda (5,351)
Demography
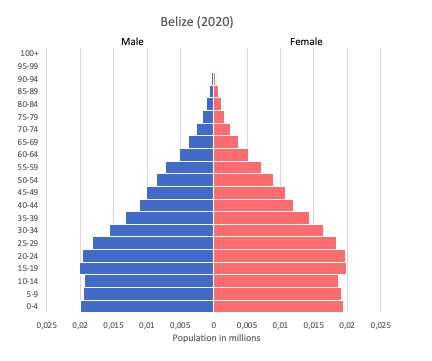
Population pyramid
Age structure data
Estimate for 2020:
- 0-14 years: 32.57% (male 66,454/female 63,700)
- 15-24 years: 19% (male 39,238/female 36,683)
- 25-54 years: 37.72% (male 73,440/female 77,300)
- 55-64 years: 6.18% (male 12,235/female 12,444)
- 65 years and over: 4.53% (male 8,781/female 9,323)
Remark: the age structure of a population affects a nation’s key socioeconomic issues. Countries with young populations (high percentage under age 15) need to invest more in schools, while countries with older populations (high percentage ages 65 and over) need to invest more in the health sector. The age structure can also be used to help predict potential political issues. For example, the rapid growth of a young adult population unable to find employment can lead to unrest.
Population from 1950 to 2020
Source: United Nations, Department of Economic and Social Affairs, Population Division (2019). World Population Prospects 2019, Online Edition. Rev. 1.
Evolution of the life expectancy from 1960 to 2018
Source: World Development Indicators, The World Bank
Economy
Agriculture:
bananas, cacao, citrus, sugar, fish, cultured shrimp, lumber
Industries:
garment production, food processing, tourism, construction, oil
Exports – commodities:
sugar, bananas, citrus, clothing, fish products, molasses, wood, crude oil
Imports – commodities:
machinery and transport equipment, manufactured goods, fuels, chemicals, pharmaceuticals, food, beverages, tobacco
Time zone and current time in Belize
Go to our interactive map to get the current time in Belize
Source:
- CIA World Factbook
- United Nations, Department of Economic and Social Affairs, Population Division. World Population Prospects: The 2019 Revision. (Medium variant)
- Wikipedia
1 Percentages add up to more than 100% because respondents were able to identify more than one ethnic origin