Egypt
| Government | |
| Name | Arab Republic of Egypt |
| Arabic | جمهورية مصر العربية |
| Government type | Presidential republic |
| Capital | Cairo (9,153,135 (2017)) |
| Currency | Egyptian pound (EGP) |
| People | |
| Population (2020) | 102,334,403 (13th) |
| Density of population | 100 P/km2 (83th) |
| Nationality | Egyptian |
| Official languages | |
| Arabic | |
| Ethnic groups (2006) | |
| Egyptian | 99.7% |
| Other | 0.3% |
| Religions (2015) | |
| Muslim (predominantly Sunni) | 90% |
| Life expectancy (2020) | |
| Male | 72.3 years |
| Female | 75.3 years |
| Total population | 73.7 years (140th) |
| Homicides | |
| Total (2012) | 2.6 per 100,000 people (89th) |
| Geography | |
| Land area | 995,450 km2 |
| water area | 6,000 km2 |
| total area | 1,001,450 km2 (31st) |
| Mean elevation | 321 m |
| Lowest point | |
| Qattara Depression | -133 m |
| Highest point | |
| Mount Catherine | 2,629 m |
| Land use (2011) | |
| Agricultural land | 3.6% |
| Arable land | 2.8% |
| Permanent crops | 0.8% |
| Permanent pasture | 0% |
| Forest | 0.1% |
| Other | 96.3% |
| Urbanization | |
| Urban population (2020) | 42.8% |
| Rate of urbanization | 1.86% annual rate of change (2015 – 2020) |
| Economy | |
| Labor force (2017) | 29.95 million (22nd) |
| Labor force by occupation (2015) | |
| Agriculture | 25.8% |
| Industry | 25.1% |
| Services | 49.1% |
| Unemployment rate (2017) | 12.2% (161st) |
| GDP (PPP) (estimate 2019) | |
| Total | $1.391 trillion (19th) |
| Per capita | $14,023(94th) |
| GDP (nominal) (estimate 2019) | |
| Total | $302.256 billion (40th) |
| Per capita | $3,047 (126th) |
| GDP by sector (estimate 2017) | |
| Agriculture | 11.7% |
| Industry | 34.3% |
| Services | 54% |
| Exports (2017) | $23.3 billion (67th) |
| Exports partners (2017) | |
| UAE | 10.9% |
| Italy | 10% |
| US | 7.4% |
| UK | 5.7% |
| Turkey | 4.4% |
| Germany | 4.3% |
| India | 4.3 |
| Imports (2017) | $59.78 billion (50th) |
| Imports partners (2017) | |
| China | 7.9% |
| UAE | 5.2% |
| Germany | 4.8% |
| Saudi Arabia | 4.6% |
| US | 4.4% |
| Russia | 4.3% |
Egypt on the world map
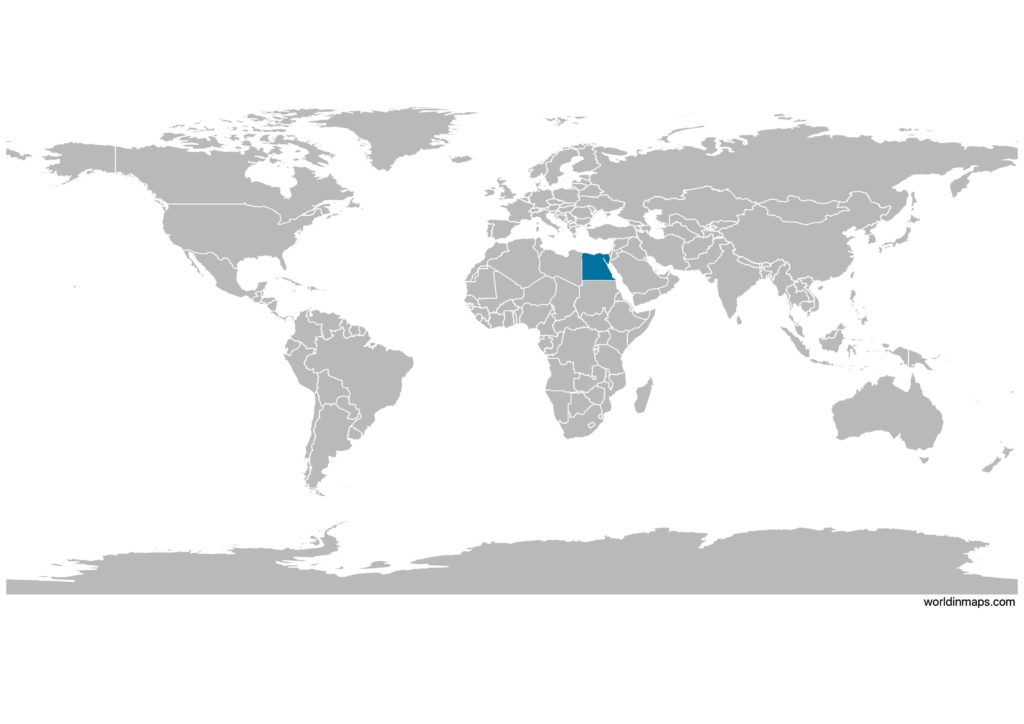
Egypt is located in Africa and more specifically in the Middle East region.
Egypt top 10 largest cities (2017)
- Cairo (9,153,135)
- Alexandria (5,039,975)
- Giza (4,146,340)
- Shubra El Kheima (1,165,914)
- Port Said (751,073)
- Suez (660,592)
- Mansoura (548,259)
- El Mahalla El Kubra (522,799)
- Tanta (508,754)
- Faiyum (475,139)
Demography
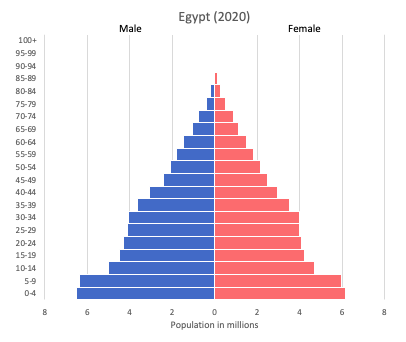
Population pyramid
Age structure data
Estimate for 2020:
- 0-14 years: 33.62% (male 18,112,550/female 16,889,155)
- 15-24 years: 18.01% (male 9,684,437/female 9,071,163)
- 25-54 years: 37.85% (male 20,032,310/female 19,376,847)
- 55-64 years: 6.08% (male 3,160,438/female 3,172,544)
- 65 years and over: 4.44% (male 2,213,539/female 2,411,457)
Remark: the age structure of a population affects a nation’s key socioeconomic issues. Countries with young populations (high percentage under age 15) need to invest more in schools, while countries with older populations (high percentage ages 65 and over) need to invest more in the health sector. The age structure can also be used to help predict potential political issues. For example, the rapid growth of a young adult population unable to find employment can lead to unrest.
Population from 1950 to 2020
Source: United Nations, Department of Economic and Social Affairs, Population Division (2019). World Population Prospects 2019, Online Edition. Rev. 1.
Evolution of the life expectancy from 1960 to 2018
Source: World Development Indicators, The World Bank
Major rivers
Economy
Agriculture:
cotton, rice, corn, wheat, beans, fruits, vegetables; cattle, water buffalo, sheep, goats
Industries:
textiles, food processing, tourism, chemicals, pharmaceuticals, hydrocarbons, construction, cement, metals, light manufactures
Exports – commodities:
crude oil and petroleum products, fruits and vegetables, cotton, textiles, metal products, chemicals, processed food
Imports – commodities:
machinery and equipment, foodstuffs, chemicals, wood products, fuels
Time zone and current time in Egypt
Go to our interactive map to get the current time in Egypt