El Salvador
| Government | |
| Name | Republic of El Salvador |
| Spanish | República de El Salvador |
| Government type | Presidential republic |
| Capital | San Salvador (540,989 (2007)) |
| Currency | United States dollar (USD) |
| People | |
| Population (2020) | 6,486,201 (109th) |
| Density of population | 303.1 P/km2 (47th) |
| Nationality | Salvadoran |
| Official languages | |
| Spanish | |
| Ethnic groups (2007) | |
| Mestizo | 86.3% |
| White | 12.7% |
| Amerindian 0.2% (includes Lenca, Kakawira, Nahua-Pipil), | 0.2% |
| Black | 0.1% |
| Other | 0.6% |
| Religions (2014) | |
| Roman Catholic | 50% |
| Protestant | 36% |
| Other | 2% |
| None | 12% |
| Life expectancy (2020) | |
| Male | 71.3 years |
| Female | 78.6 years |
| Total population | 74.8 years (124th) |
| Homicides | |
| Total (2018) | 52.0 per 100,000 people (1st) |
| Geography | |
| Land area | 20,721 km2 |
| water area | 320 km2 |
| total area | 21,041 km2 (154th) |
| Mean elevation | 442 m |
| Lowest point | |
| Pacific Ocean | 0 m |
| Highest point | |
| Cerro El Pital | 2,730 m |
| Land use (2011) | |
| Agricultural land | 74.7% |
| Arable land | 33.1% |
| Permanent crops | 10.9% |
| Permanent pasture | 30.7% |
| Forest | 13.6% |
| Other | 11.7% |
| Urbanization | |
| Urban population (2020) | 73.4% |
| Rate of urbanization | 1.57% annual rate of change (2015 – 2020) |
| Economy | |
| Labor force (2017) | 2.774 million (109th) |
| Labor force by occupation (2011) | |
| Agriculture | 21% |
| Industry | 20% |
| Services | 58% |
| Unemployment rate (2017) | 7% (107th) |
| GDP (PPP) (estimate 2018) | |
| Total | $53.667 billion (101st) |
| Per capita | $8,388(111th) |
| GDP (nominal) (estimate 2018) | |
| Total | $25.855 billion (102nd) |
| Per capita | $4,041 (111th) |
| GDP by sector (estimate 2017) | |
| Agriculture | 12% |
| Industry | 27.7% |
| Services | 60.3% |
| Exports (2017) | $4.662 billion (111th) |
| Exports partners (2017) | |
| US | 45.7% |
| Honduras | 13.9% |
| Guatemala | 13.5% |
| Nicaragua | 6.7% |
| Costa Rica | 4.6% |
| Imports (2017) | $9.499 billion (103rd) |
| Imports partners (2017) | |
| US | 36.7% |
| Guatemala | 10.5% |
| China | 8.7% |
| Mexico | 7.4% |
| Honduras | 6.7% |
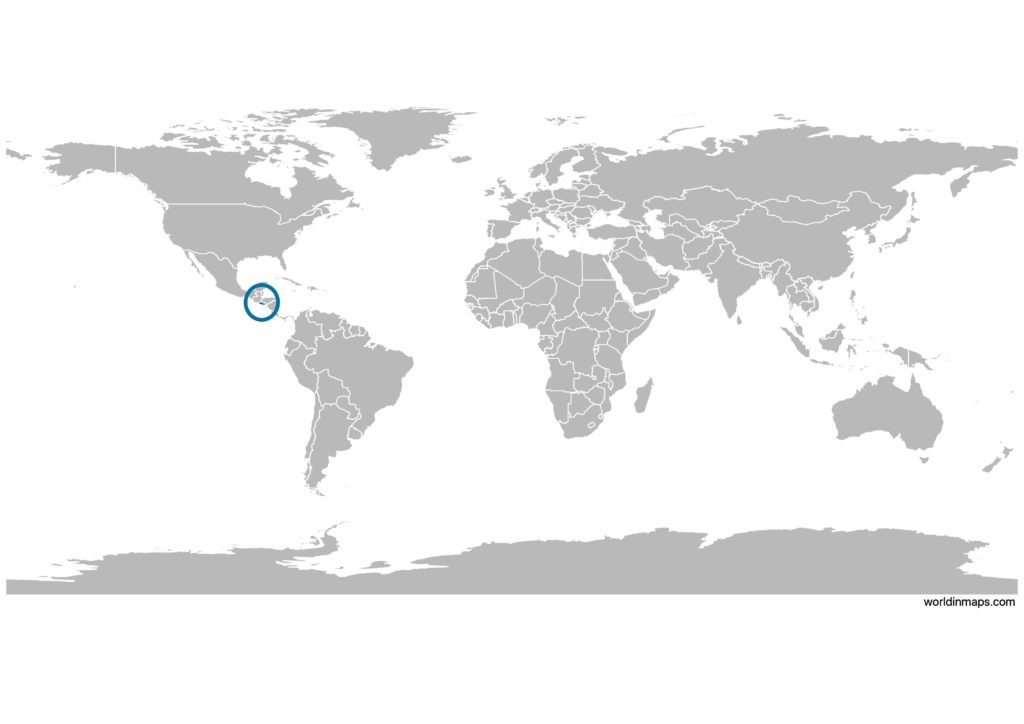
El Salvador on the world map
El Salvador top 10 largest cities (2007)
- San Salvador (540,989)
- Santa Ana (245,421)
- Soyapango (241,403)
- San Miguel (218,410)
- Santa Tecla (164,171)
- Mejicanos (140,751)
- Apopa (131,286)
- Delgado (120,200)
- Ahuachapán (110,511)
- Ilopango (103,862)
Demography
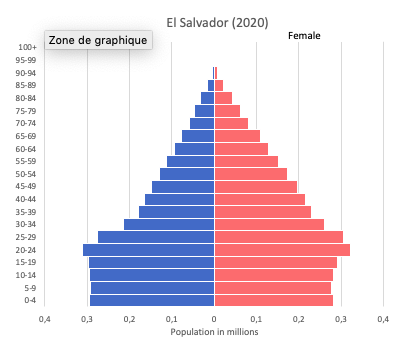
Population pyramid
Age structure data
Estimate for 2020:
- 0-14 years: 25.83% (male 857,003/female 817,336)
- 15-24 years: 18.82% (male 619,368/female 600,501)
- 25-54 years: 40.51% (male 1,221,545/female 1,404,163)
- 55-64 years: 7.23% (male 198,029/female 270,461)
- 65 years and over: 7.6% (male 214,717/female 277,979)
Remark: the age structure of a population affects a nation’s key socioeconomic issues. Countries with young populations (high percentage under age 15) need to invest more in schools, while countries with older populations (high percentage ages 65 and over) need to invest more in the health sector. The age structure can also be used to help predict potential political issues. For example, the rapid growth of a young adult population unable to find employment can lead to unrest.
Population from 1950 to 2020
Source: United Nations, Department of Economic and Social Affairs, Population Division (2019). World Population Prospects 2019, Online Edition. Rev. 1.
Evolution of the life expectancy from 1960 to 2018
Source: World Development Indicators, The World Bank
Economy
Agriculture:
coffee, sugar, corn, rice, beans, oilseed, cotton, sorghum; beef, dairy products
Industries:
food processing, beverages, petroleum, chemicals, fertilizer, textiles, furniture, light metals
Exports – commodities:
offshore assembly exports, coffee, sugar, textiles and apparel, ethanol, chemicals, electricity, iron and steel manufactures
Imports – commodities:
raw materials, consumer goods, capital goods, fuels, foodstuffs, petroleum, electricity
Time zone and current time in El Salvador
Go to our interactive map to get the current time in El Salvador