Costa Rica

| Government | |
| Name | Republic of Costa Rica |
| Spanish | República de Costa Rica |
| Government type | Presidential republic |
| Capital | San José (333,980 (2015)) |
| Currency | Costa Rican colón (CRC) |
| People | |
| Population (2020) | 5,094,114 (121st) |
| Density of population | 84.9 P/km2 (107th) |
| Nationality | Costa Rican |
| Official languages | |
| Spanish | |
| Ethnic groups (2011) | |
| white or mestizo | 83.6% |
| mulatto | 6.7% |
| indigenous | 2.4% |
| black of African descent | 1.1% |
| other | 1.1% |
| none | 2.9% |
| unspecified | 2.2% |
| Religions (2016) | |
| Roman Catholic | 71.8% |
| Evangelical and Pentecostal | 12.3% |
| other Protestant | 2.6% |
| Jehovah’s Witness | 0.5% |
| other | 2.4% |
| none | 10.4% |
| Life expectancy (2020) | |
| Male | 76.5 years |
| Female | 82 years |
| Total population | 79.2 years (58th) |
| Homicides | |
| Total (2018) | 11.3 per 100,000 people (29th) |
| Geography | |
| Land area | 51,060 km2 |
| water area | 40 km2 |
| total area | 51,100 km2 (130th) |
| Mean elevation | 746 m |
| Lowest point | |
| Pacific Ocean | 0 m |
| Highest point | |
| Cerro Chirripo | 3,819 m |
| Land use (2011) | |
| Agricultural land | 37.1% |
| Arable land | 4.9% |
| Permanent crops | 6.7% |
| Permanent pasture | 25.5% |
| Forest | 51.5% |
| Other | 11.4% |
| Urbanization | |
| Urban population (2020) | 80.8% |
| Rate of urbanization | 1.5% annual rate of change (2015 – 2020) |
| Economy | |
| Labor force (2017) note: excludes Nicaraguans living in Costa Rica | 2.229 million (121st) |
| Labor force by occupation (2013) | |
| Agriculture | 14% |
| Industry | 22% |
| Services | 64% |
| Unemployment rate (2017) | 8.1% (117th) |
| GDP (PPP) (estimate 2020) | |
| Total | $95.791 billion |
| Per capita | $18,651 |
| GDP (nominal) (estimate 2020) | |
| Total | $65.179 billion |
| Per capita | $12,690 |
| GDP by sector (estimate 2017) | |
| Agriculture | 5.5% |
| Industry | 20.6% |
| Services | 73.9% |
| Exports (2017) | $10.81 billion (90th) |
| Exports partners (2017) | |
| US | 40.9% |
| Belgium | 6.3% |
| Panama | 5.6% |
| Netherlands | 5.6% |
| Nicaragua | 5.1% |
| Guatemala | 5% |
| Imports (2017) | $15.15 billion (89th) |
| Imports partners (2017) | |
| US | 38.1% |
| China | 13.1% |
| Mexico | 7.3% |
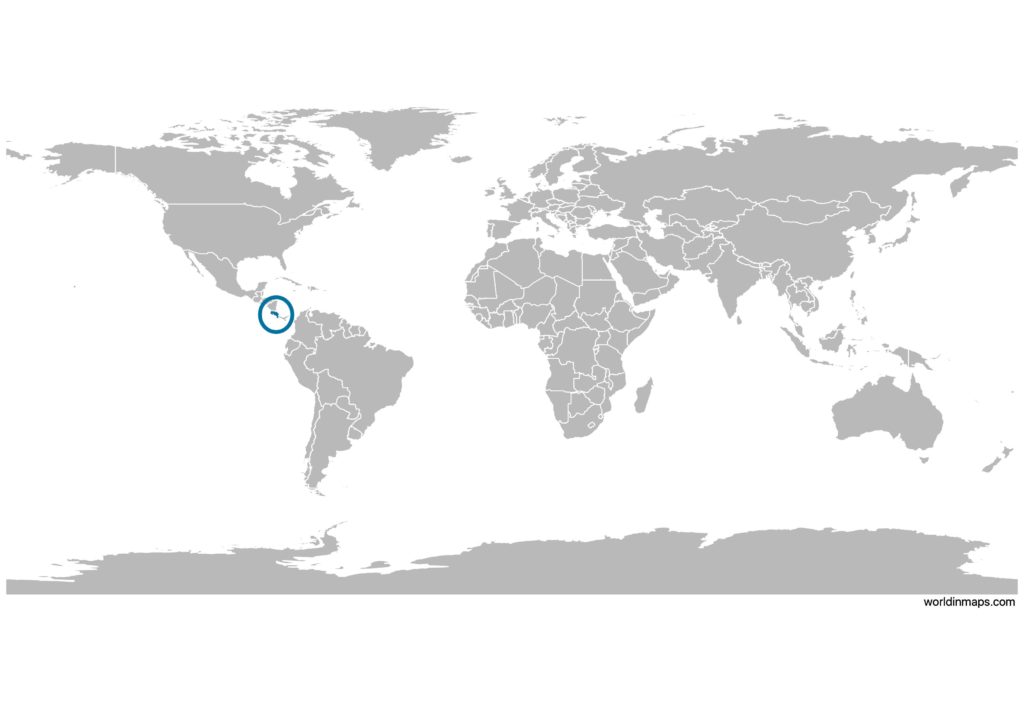
Costa Rica on the world map
Costa Rica top 10 largest cities (2000)
- San José (333,980 (2015))
- Puerto Limón (55,667)
- Alajuela (42,889)
- Heredia (40,840)
- Cinco Esquinas (36,627)
- Desamparados (36,437)
- Liberia (34,469)
- Puntarenas (32,460)
- San Vicente (31,693)
- Barranca (31,386)
Demography
Population pyramid
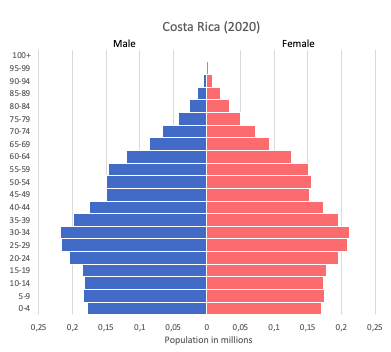
Age structure data
Estimate for 2020:
- 0-14 years: 22.08% (male 575,731/female 549,802)
- 15-24 years: 15.19% (male 395,202/female 379,277)
- 25-54 years: 43.98% (male 1,130,387/female 1,111,791)
- 55-64 years: 9.99% (male 247,267/female 261,847)
- 65 years and over: 8.76% (male 205,463/female 241,221)
Remark: the age structure of a population affects a nation’s key socioeconomic issues. Countries with young populations (high percentage under age 15) need to invest more in schools, while countries with older populations (high percentage ages 65 and over) need to invest more in the health sector. The age structure can also be used to help predict potential political issues. For example, the rapid growth of a young adult population unable to find employment can lead to unrest.
Population from 1950 to 2020
Source: United Nations, Department of Economic and Social Affairs, Population Division (2019). World Population Prospects 2019, Online Edition. Rev. 1.
Evolution of the life expectancy from 1960 to 2018
Source: World Development Indicators, The World Bank
Economy
Agriculture:
bananas, pineapples, coffee, melons, ornamental plants, sugar, corn, rice, beans, potatoes, beef, poultry, dairy, timber
Industries:
medical equipment, food processing, textiles and clothing, construction materials, fertilizer, plastic products
Exports – commodities:
bananas, pineapples, coffee, melons, ornamental plants, sugar; beef, seafood, electronic components, medical equipment
Imports – commodities:
raw materials, consumer goods, capital equipment, petroleum, construction materials
Time zone and current time in Costa Rica
Go to our interactive map to get the current time in Costa Rica