Nicaragua
| Government | |
| Name | Republic of Nicaragua |
| Spanish | República de Nicaragua |
| Government type | presidential republic |
| Capital | Managua (1,042,641 (2016)) |
| Currency | córdoba (NIO) |
| People | |
| Population (2020) | 6,624,554 (112th) |
| Density of population | 51 P/km2 (155th) |
| Nationality | Nicaraguan |
| Official languages | |
| Spanish | |
| Ethnic groups | |
| mestizo (mixed Amerindian and white) | 69% |
| white | 17% |
| black | 9% |
| Amerindian | 5% |
| Religions (2017) | |
| Roman Catholic | 50% |
| Evangelical | 33.2% |
| other | 2.9% |
| unspecified | 13.2% |
| none | 0.7% |
| Life expectancy (2020) | |
| Male | 72 years |
| Female | 76.6 years |
| Total population | 74.2 years (134th) |
| Homicides | |
| Total (2016) | 7.2 per 100,000 people (44th) |
| Geography | |
| Land area | 119,990 km2 |
| water area | 10,380 km2 |
| total area | 130,370 km2 (99th) |
| Mean elevation | 298 m |
| Lowest point | |
| Pacific Ocean | 0 m |
| Highest point | |
| Mogoton | 2,085 m |
| Land use (2011) | |
| Agricultural land | 42.2% |
| Arable land | 12.5% |
| Permanent crops | 2.5% |
| Permanent pasture | 27.2% |
| Forest | 25.3% |
| Other | 32.5% |
| Urbanization | |
| Urban population (2020) | 59% |
| Rate of urbanization | 1.45% annual rate of change (2015 – 2020) |
| Economy | |
| Labor force (2017) | 3.046 million (103rd) |
| Labor force by occupation (2011) | |
| Agriculture | 31% |
| Industry | 18% |
| Services | 50% |
| Unemployment rate (2017) | 6.4% (95th) |
| GDP (PPP) (estimate 2018) | |
| Total | $35.757 billion (115th) |
| Per capita | $5,683 (129th) |
| GDP (nominal) (estimate 2018) | |
| Total | $13.380 billion (127th) |
| Per capita | $2,126 (134th) |
| GDP by sector (estimate 2017) | |
| Agriculture | 15.5% |
| Industry | 24.4% |
| Services | 60% |
| Exports (2017) | $3.819 billion (119th) |
| Exports partners (2017) | |
| US | 44.2% |
| El Salvador | 6.4% |
| Venezuela | 5.5% |
| Costa Rica | 5.5% |
| Imports (2017) | $6.613 billion (116th) |
| Imports partners (2017) | |
| US | 20.8% |
| China | 14.3% |
| Mexico | 11.1% |
| Costa Rica | 7.9% |
| Guatemala | 7% |
| El Salvador | 5.6% |
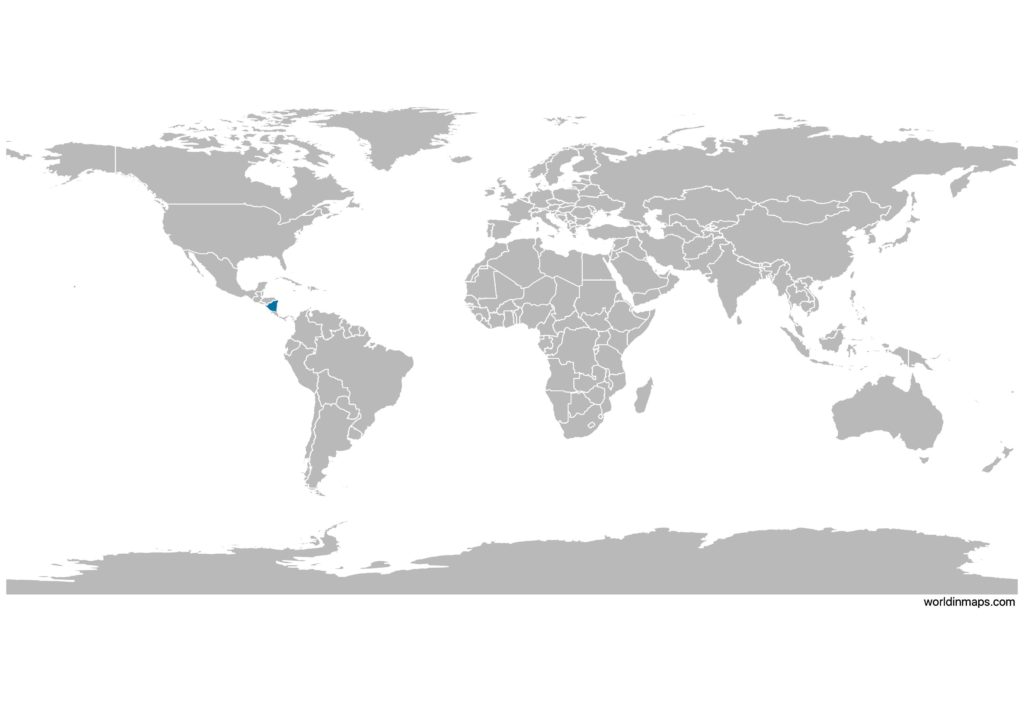
Nicaragua on the world map
Nicaragua top 10 largest cities (2016)
- Managua (1,042,641)
- León (206,264)
- Masaya (176,344)
- Matagalpa (158,095)
- Tipitapa (140,569)
- Chinandega (135,154)
- Jinotega (133,705)
- Granada (127,892)
- Estelí (126,290)
- Puerto Cabezas (113,534)
Demography
Population pyramid
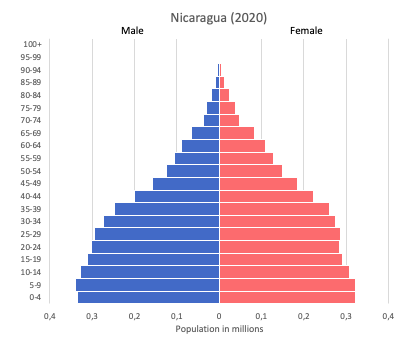
Age structure data
Estimate for 2020:
- 0-14 years: 25.63% (male 811,731/female 777,984)
- 15-24 years: 19.51% (male 609,962/female 600,567)
- 25-54 years: 42.41% (male 1,254,683/female 1,376,052)
- 55-64 years: 6.63% (male 188,591/female 222,766)
- 65 years and over: 5.82% (male 159,140/female 201,965)
Remark: the age structure of a population affects a nation’s key socioeconomic issues. Countries with young populations (high percentage under age 15) need to invest more in schools, while countries with older populations (high percentage ages 65 and over) need to invest more in the health sector. The age structure can also be used to help predict potential political issues. For example, the rapid growth of a young adult population unable to find employment can lead to unrest.
Population from 1950 to 2020
Source: United Nations, Department of Economic and Social Affairs, Population Division (2019). World Population Prospects 2019, Online Edition. Rev. 1.
Evolution of the life expectancy from 1960 to 2018
Source: World Development Indicators, The World Bank
Economy
Agriculture:
coffee, bananas, sugarcane, rice, corn, tobacco, cotton, sesame, soya, beans, beef, veal, pork, poultry, dairy products, shrimp, lobsters, peanuts
Industries:
food processing, chemicals, machinery and metal products, knit and woven apparel, petroleum refining and distribution, beverages, footwear, wood, electric wire harness manufacturing, mining
Exports – commodities:
coffee, beef, gold, sugar, peanuts, shrimp and lobster, tobacco, cigars, automobile wiring harnesses, textiles, apparel
Imports – commodities:
consumer goods, machinery and equipment, raw materials, petroleum products
Time zone and current time in Nicaragua
Go to our interactive map to get the current time in Nicaragua