Ethiopia
| Government | |
| Name | Federal Democratic Republic of Ethiopia |
| Government type | Federal parliamentary republic |
| Capital | Addis Ababa (3,352,000 (2016)) |
| Currency | Birr (ETB) |
| People | |
| Population (2020) | 114,963,583 (12th) |
| Density of population | 92.7 P/km2 (123rd) |
| Nationality | Ethiopian |
| Official languages | |
| Amharic (national) | |
| Oromo (State of Oromiya) | |
| Somali (State of Sumale) | |
| Tigrigna (Tigrinya) (State of Tigray) | |
| Afar (State of Afar) | |
| Ethnic groups (2007) | |
| Oromo | 34.4% |
| Amhara (Amara) | 27% |
| Somali (Somalie) | 6.2% |
| Tigray (Tigrinya) | 6.1% |
| Sidama | 4% |
| Gurage | 2.5% |
| Welaita | 2.3% |
| Hadiya | 1.7% |
| Afar (Affar) | 1.7% |
| Gamo | 1.5% |
| Gedeo | 1.3% |
| Silte | 1.3% |
| Kefficho | 1.2% |
| Other | 8.8% |
| Religions (2007) | |
| Ethiopian Orthodox | 43.5% |
| Muslim | 33.9% |
| Protestant | 18.5% |
| Traditional | 2.7% |
| Catholic | 0.7% |
| Other | 0.6% |
| Life expectancy (2020) | |
| Male | 65.5 years |
| Female | 69.7 years |
| Total population | 67.5 years (180st) |
| Homicides | |
| Total (2012) | 8.8 per 100,000 people (39th) |
| Geography | |
| Land area | 1,096,570 km2 |
| water area | 7,730 km2 |
| total area | 1,104,300 km2 (28th) |
| Mean elevation | 1,330 m |
| Lowest point | |
| Danakil Depression | -125 m |
| Highest point | |
| Ras Dejen | 4,550 m |
| Land use (2011) | |
| Agricultural land | 36.3% |
| Arable land | 15.2% |
| Permanent crops | 1.1% |
| Permanent pasture | 20% |
| Forest | 12.2% |
| Other | 51.5% |
| Urbanization | |
| Urban population (2020) | 21.7% |
| Rate of urbanization | 4.63% annual rate of change (2015 – 2020) |
| Economy | |
| Labor force (2017) | 52.82 million (13th) |
| Labor force by occupation (2013) | |
| Agriculture | 72.7% |
| Industry | 7.4% |
| Services | 19.9% |
| Unemployment rate (2012) | 17.5% (180th) |
| GDP (PPP) (estimate 2019) | |
| Total | $240.168 billion |
| Per capita | $2,701 |
| GDP (nominal) (estimate 2020) | |
| Total | $103.607 billion |
| Per capita | $1,066 |
| GDP by sector (estimate 2017) | |
| Agriculture | 34.8% |
| Industry | 21.6% |
| Services | 43.6% |
| Exports (2017) | $3.23 billion (126th) |
| Exports partners (2017) | |
| Sudan | 23.3% |
| Switzerland | 10.2% |
| China | 8.1% |
| Somalia | 6.6% |
| Netherlands | 6.2% |
| US | 4.7% |
| Germany | 4.7% |
| Saudi Arabia | 4.6% |
| UK | 4.6% |
| Imports (2017) | $15.59 billion (88th) |
| Imports partners (2017) | |
| China | 24.1% |
| Saudi Arabia | 10.1% |
| India | 6.4% |
| Kuwait | 5.3% |
| France | 5.2% |
Ethiopia on the world map
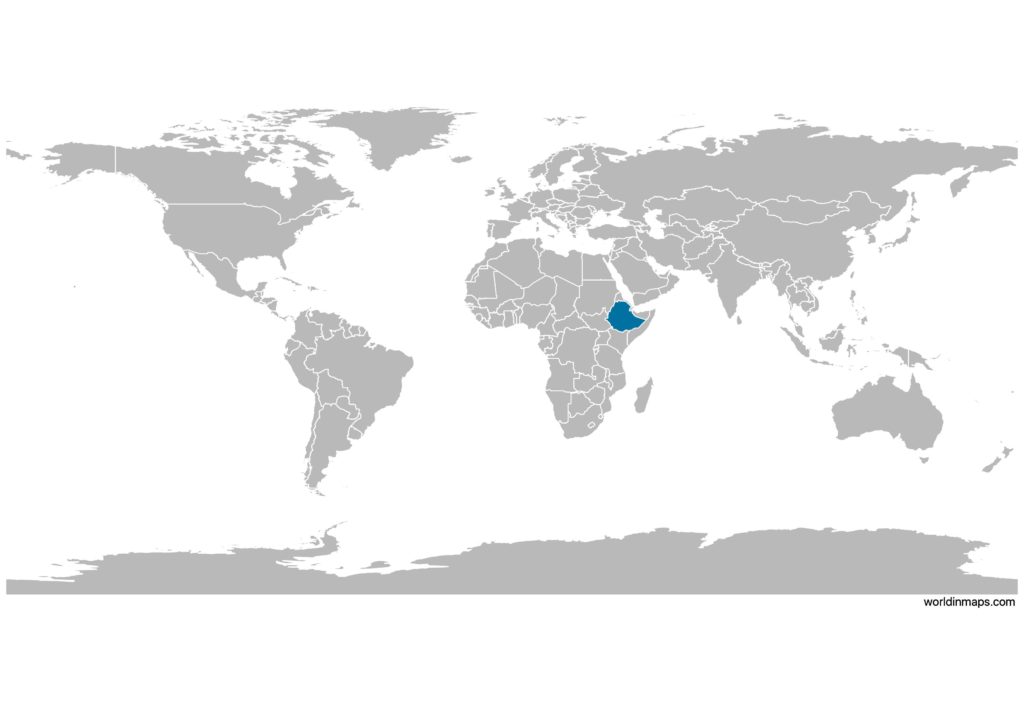
Ethiopia is located in Africa in the Horn of Africa.
Ethiopia top 10 largest cities (2016)
- Addis Ababa (3,352,000)
- Adama (342,940)
- Gondar (341,991)
- Mekelle (340,858)
- Hawassa (318,618)
- Bahir Dar (297,794)
- Dire Dawa (285,000)
- Dessie (198,428)
- Jimma (186,148)
- Jijiga (164,321)
Demography
Population pyramid
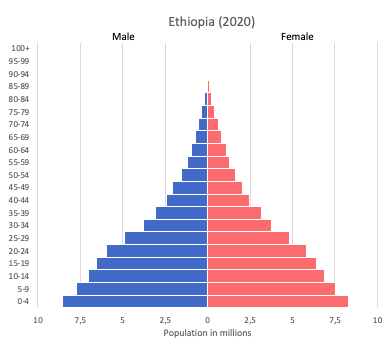
Age structure data
Estimate for 2020:
- 0-14 years: 39.81% (male 21,657,152/female 21,381,628)
- 15-24 years: 19.47% (male 10,506,144/female 10,542,128)
- 25-54 years: 32.92% (male 17,720,540/female 17,867,298)
- 55-64 years: 4.42% (male 2,350,606/female 2,433,319)
- 65 years and over: 3.38% (male 1,676,478/female 1,977,857)
Remark: the age structure of a population affects a nation’s key socioeconomic issues. Countries with young populations (high percentage under age 15) need to invest more in schools, while countries with older populations (high percentage ages 65 and over) need to invest more in the health sector. The age structure can also be used to help predict potential political issues. For example, the rapid growth of a young adult population unable to find employment can lead to unrest.
Population from 1950 to 2020
Source: United Nations, Department of Economic and Social Affairs, Population Division (2019). World Population Prospects 2019, Online Edition. Rev. 1.
Evolution of the life expectancy from 1960 to 2018
Source: World Development Indicators, The World Bank
Economy
Agriculture:
cereals, coffee, oilseed, cotton, sugarcane, vegetables, khat, cut flowers, hides, cattle, sheep, goats, fish
Industries:
food processing, beverages, textiles, leather, garments, chemicals, metals processing, cement
Exports – commodities:
coffee (27%, by value), oilseeds (17%), edible vegetables including khat (17%), gold (13%), flowers (7%), live animals (7%), raw leather products (3%), meat products (3%)
Imports – commodities:
machinery and aircraft (14%, by value), metal and metal products, (14%), electrical materials, (13%), petroleum products (12%), motor vehicles, (10%), chemicals and fertilizers (4%)
Time zone and current time in Ethiopia
Go to our interactive map to get the current time in Ethiopia