Grenada
| Government | |
| Name | Grenada |
| Grenadian Creole French | Gwenad |
| Government type | Parliamentary democracy under a constitutional monarchy (a Commonwealth realm) |
| Capital | Saint George’s(33,734 (2012)) |
| Currency | East Caribbean dollar (XCD) |
| Organization | |
| Member State | Commonwealth of Nations |
| People | |
| Population (2020) | 112,519 (194st) |
| Density of population | 318.58 P/km2 (45th) |
| Nationality | Grenadian |
| Official languages | |
| English | |
| Ethnic groups (2011) | |
| African descent | 82.4% |
| Mixed | 13.3% |
| East Indian | 2.2% |
| Other | 1.3% |
| Unspecified | 0.9% |
| Religions (2009) | |
| Protestant | 49.2% |
| Pentecostal | 17.2% |
| Seventh Day Adventist | 13.2% |
| Anglican | 8.5% |
| Baptist | 3.2% |
| Church of God | 2.4% |
| Evangelical | 1.9% |
| Methodist | 1.6% |
| Other | 1.2% |
| Roman Catholic | 36% |
| Jehovah’s Witness | 1.2% |
| Rastafarian | 1.2% |
| Other | 5.5% |
| None | 5.7% |
| Unspecified | 1.3% |
| Life expectancy (2020) | |
| Male | 72.6 years |
| Female | 78.1 years |
| Total population | 75.2 years (119th) |
| Homicides | |
| Total (2017) | 10.8 per 100,000 people (32nd) |
| Geography | |
| Land area | 344 km2 |
| water area | 0 km2 |
| total area | 344 km2 (2008th) |
| Lowest point | |
| Caribbean Sea | 0 m |
| Highest point | |
| Mount Saint Catherine | 840 m |
| Land use (2011) | |
| Agricultural land | 32.3% |
| Arable land | 8.8% |
| Permanent crops | 20.6% |
| Permanent pasture | 2.9% |
| Forest | 50% |
| Other | 17.7% |
| Urbanization | |
| Urban population (2020) | 36.5% |
| Rate of urbanization | 0.76% annual rate of change (2015 – 2020) |
| Economy | |
| Labor force (2017) | 55,270 (189th) |
| Labor force by occupation (2008) | |
| Agriculture | 11% |
| Industry | 20% |
| Services | 69% |
| Unemployment rate (2017) | 24% (195th) |
| GDP (PPP) (estimate 2019) | |
| Total | $1.801 billion |
| Per capita | $16,604 |
| GDP (nominal) (estimate 2019) | |
| Total | $1.249 billion |
| Per capita | $11,518 |
| GDP by sector (estimate 2017) | |
| Agriculture | 6.8% |
| Industry | 15.5% |
| Services | 77.7% |
| Exports (2017) | $39.9 million (205th) |
| Exports partners (2017) | |
| US | 25.3% |
| Japan | 10.1% |
| Guyana | 8.7% |
| Dominica | 6.6% |
| St. Lucia | 6.4% |
| Netherlands | 4.7% |
| Barbados | 4.1% |
| St. Kitts and Nevis | 4% |
| Imports (2017) | $316 million (203rd) |
| Imports partners (2017) | |
| US | 31.7% |
| Trinidad and Tobago | 24.9% |
| China | 6.7% |
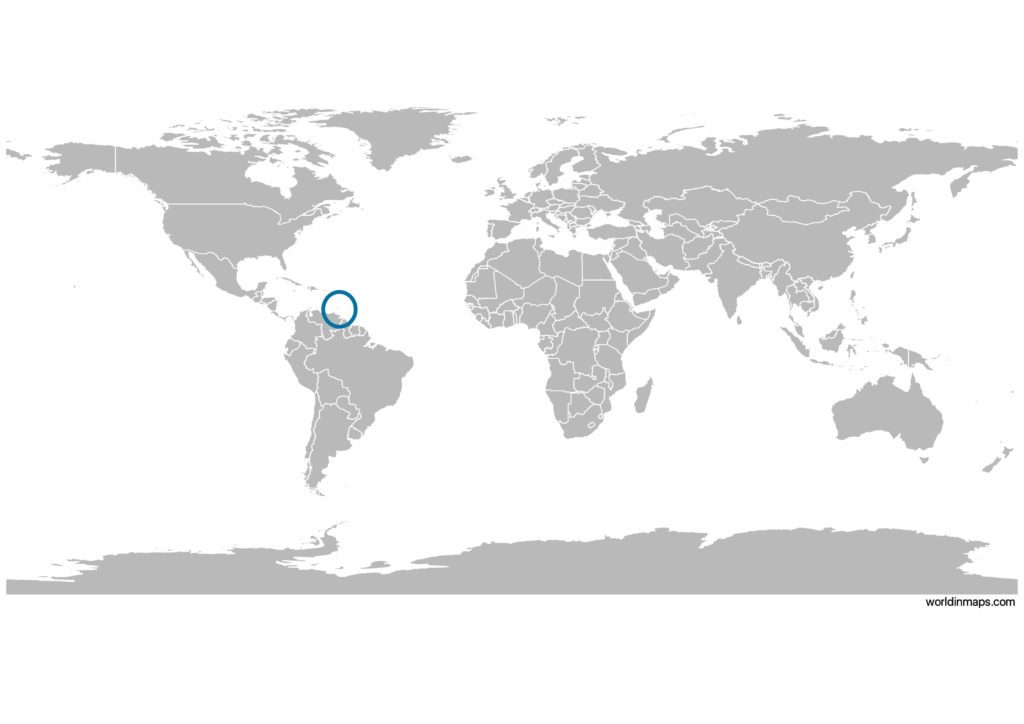
Grenada on the world map
Demography
Population pyramid
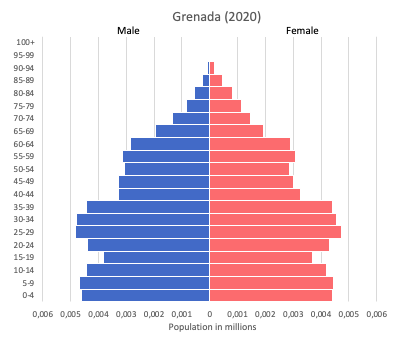
Age structure data
Estimate for 2020:
- 0-14 years: 23.23% (male 13,709/female 12,564)
- 15-24 years: 14.14% (male 8,034/female 7,959)
- 25-54 years: 40.05% (male 23,104/female 22,187)
- 55-64 years: 11.69% (male 6,734/female 6,490)
- 65 years and over: 10.89% (male 5,774/female 6,539)
Remark: the age structure of a population affects a nation’s key socioeconomic issues. Countries with young populations (high percentage under age 15) need to invest more in schools, while countries with older populations (high percentage ages 65 and over) need to invest more in the health sector. The age structure can also be used to help predict potential political issues. For example, the rapid growth of a young adult population unable to find employment can lead to unrest.
Population from 1950 to 2020
Source: United Nations, Department of Economic and Social Affairs, Population Division (2019). World Population Prospects 2019, Online Edition. Rev. 1.
Evolution of the life expectancy from 1960 to 2018
Source: World Development Indicators, The World Bank
Economy
Agriculture:
bananas, cocoa, nutmeg, mace, soursop, citrus, avocados, root crops, corn, vegetables, fish
Industries:
food and beverages, textiles, light assembly operations, tourism, construction, education, call-center operations
Exports – commodities:
nutmeg, bananas, cocoa, fruit and vegetables, clothing, mace, chocolate, fish
Imports – commodities:
food, manufactured goods, machinery, chemicals, fuel
Time zone and current time in Grenada
Go to our interactive map to get the current time in Grenada