Macedonia
| Government | |
| Name | Republic of North Macedonia |
| Macedonian | Република Северна Македонија |
| Albanian | Republika e Maqedonisë së Veriut |
| Government type | parliamentary republic |
| Capital | Skopje 506,926 (2002)) |
| Currency | Macedonian denar (MKD) |
| People | |
| Population (2020) | 2,083,380 |
| Density of population | 80.1 P/km2 (122nd) |
| Nationality | Macedonian |
| Official languages | |
| Macedonian | |
| Ethnic groups (2002) | |
| Macedonian | 64.2% |
| Albanian | 25.2% |
| Turkish | 3.9% |
| Romani | 2.7% |
| Serb | 1.8% |
| other | 2.2% |
| note: Romani populations are usually underestimated in official statistics (it may represent 6.5–13%) | |
| Religions (2002) | |
| Macedonian Orthodox | 64.8% |
| Muslim | 33.3% |
| other Christian | 0.4% |
| other and unspecified | 1.5% |
| Life expectancy (2020) | |
| Male | 74.2 years |
| Female | 78.6 years |
| Total population | 76.3 years (97th) |
| Homicides | |
| Total (2018) | 1.2 per 100,000 people (131st) |
| Geography | |
| Land area | 25,433 km2 |
| water area | 280 km2 |
| total area | 25,713 km2 (150th) |
| Mean elevation | 741 m |
| Lowest point | |
| Vardar River | 50 m |
| Highest point | |
| Golem Korab (Maja e Korabit) | 2,764 m |
| Land use (2011) | |
| Agricultural land | 44.3% |
| Arable land | 16.4% |
| Permanent crops | 1.4% |
| Permanent pasture | 26.5% |
| Forest | 39.8% |
| Other | 15.9% |
| Urbanization | |
| Urban population (2020) | 58.5% |
| Rate of urbanization | 0.45% annual rate of change (2015 – 2020) |
| Economy | |
| Labor force (2017) | 950,800 (147th) |
| Labor force by occupation (2013) | |
| Agriculture | 16.2% |
| Industry | 29.2% |
| Services | 54.5% |
| Unemployment rate (2017) | 22.4% (191st) |
| GDP (PPP) (estimate 2019) | |
| Total | $33.822 billion |
| Per capita | $16,253 |
| GDP (nominal) (estimate 2019) | |
| Total | $12.383 billion |
| Per capita | $6,143 |
| GDP by sector (estimate 2017) | |
| Agriculture | 10.9% |
| Industry | 26.6% |
| Services | 62.5% |
| Exports (2017) | $4.601 billion (112th) |
| Exports partners (2017) | |
| Germany | 46.7% |
| Bulgaria | 6.1% |
| Serbia | 4.4% |
| Belgium | 4.1% |
| Imports (2017) | $6.63 billion (115th) |
| Imports partners (2017) | |
| Germany | 11.9% |
| UK | 10% |
| Greece | 8% |
| Serbia | 7.1% |
| China | 5.9% |
| Italy | 5.5% |
| Turkey | 4.5% |
| Bulgaria | 4.3% |
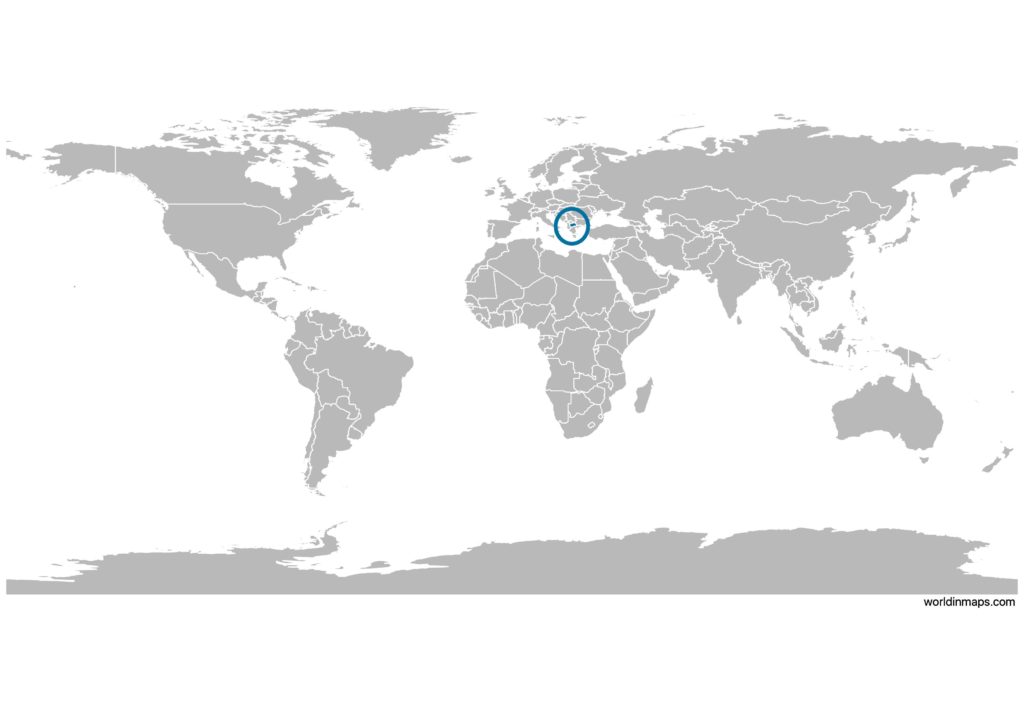
Macedonia on the world map
Macedonia top 10 largest cities (2002)
- Skopje (506,926)
- Bitola (74,550)
- Kumanovo (70,842)
- Prilep (66,246)
- Tetovo (52,915)
- Veles (43,716)
- Štip (43,652)
- Ohrid (42,033)
- Gostivar (35,847)
- Strumica (35,311)
Demography
Population pyramid
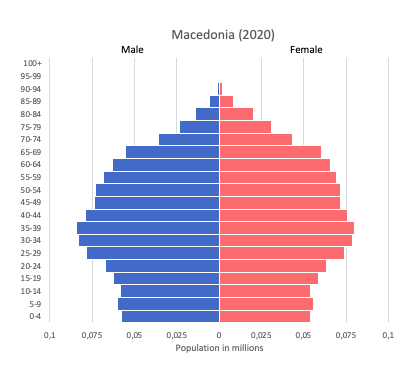
Age structure data
Estimate for 2020:
- 0-14 years: 16.16% (male 177,553/female 165,992)
- 15-24 years: 12.65% (male 139,250/female 129,770)
- 25-54 years: 44.47% (male 480,191/female 465,145)
- 55-64 years: 12.55% (male 131,380/female 135,407)
- 65 years and over: 14.17% (male 131,674/female 169,609)
Remark: the age structure of a population affects a nation’s key socioeconomic issues. Countries with young populations (high percentage under age 15) need to invest more in schools, while countries with older populations (high percentage ages 65 and over) need to invest more in the health sector. The age structure can also be used to help predict potential political issues. For example, the rapid growth of a young adult population unable to find employment can lead to unrest.
Population from 1950 to 2020
Source: United Nations, Department of Economic and Social Affairs, Population Division (2019). World Population Prospects 2019, Online Edition. Rev. 1.
Evolution of the life expectancy from 1960 to 2018
Source: World Development Indicators, The World Bank
Economy
Agriculture:
grapes, tobacco, vegetables, fruits, milk, eggs
Industries:
food processing, beverages, textiles, chemicals, iron, steel, cement, energy, pharmaceuticals, automotive parts
Exports – commodities:
foodstuffs, beverages, tobacco; textiles, miscellaneous manufactures, iron, steel; automotive parts
Imports – commodities:
machinery and equipment, automobiles, chemicals, fuels, food products
Time zone and current time in Macedonia
Go to our interactive map to get the current time in Macedonia