Malta
| Government | |
| Name | Republic of Malta |
| Maltese | Repubblika ta’ Malta |
| Government type | parliamentary republic |
| Capital | Valletta (6444 (2014)) |
| Currency | Euro (EUR) |
| Organization | |
| Member State | Commonwealth of Nations |
| People | |
| Population (2020) | 441,539 (173rd) |
| Density of population | 1,457 P/km2 (5th) |
| Nationality | Maltese |
| Official languages | |
| Maltese | |
| English | |
| Ethnic groups | |
| Maltese | 79.0% |
| Other | 21.0% |
| Religions (2006) | |
| Roman Catholic (official) | > 90% |
| Life expectancy (2020) | |
| Male | 80.7 years |
| Female | 85 years |
| Total population | 82.8 years (12th) |
| Homicides | |
| Total (2018) | 1.6 per 100,000 people (117th) |
| Geography | |
| Land area | 316 km2 |
| water area | 0 km2 |
| total area | 316 km2 (209st) |
| Lowest point | |
| Mediterranean Sea | 0 m |
| Highest point | |
| Ta’Dmejrek on Dingli Cliffs | 253 m |
| Land use (2011) | |
| Agricultural land | 32.3% |
| Arable land | 28.4% |
| Permanent crops | 3.9% |
| Permanent pasture | 0% |
| Forest | 0.9% |
| Other | 66.8% |
| Urbanization | |
| Urban population (2020) | 94.7% |
| Rate of urbanization | 0.38% annual rate of change (2015 – 2020) |
| Economy | |
| Labor force (2017) | 206,300 (169th) |
| Labor force by occupation (2016) | |
| Agriculture | 1.6% |
| Industry | 20.7% |
| Services | 77.7% |
| Unemployment rate (2017) | 4.6% (67th) |
| GDP (PPP) (estimate 2019) | |
| Total | $22.802 billion |
| Per capita | $48,246 |
| GDP (nominal) (estimate 2019) | |
| Total | $15.134 billion |
| Per capita | $32,021 |
| GDP by sector (estimate 2017) | |
| Agriculture | 1.1% |
| Industry | 10.2% |
| Services | 88.7% |
| Exports (2017) | $3.272 billion (125th) |
| Exports partners (2017) | |
| Germany | 17.3% |
| France | 10.2% |
| Italy | 9.4% |
| Singapore | 5.9% |
| Hong Kong | 5.8% |
| US | 5.7% |
| Japan | 4.9% |
| Libya | 4.5% |
| Imports (2017) | $4.996 billion (129th) |
| Imports partners (2017) | |
| Italy | 23% |
| Germany | 7.9% |
| UK | 7.7% |
| Spain | 5% |
| Canada | 4.5% |
| US | 4.3% |
| France | 4.2% |
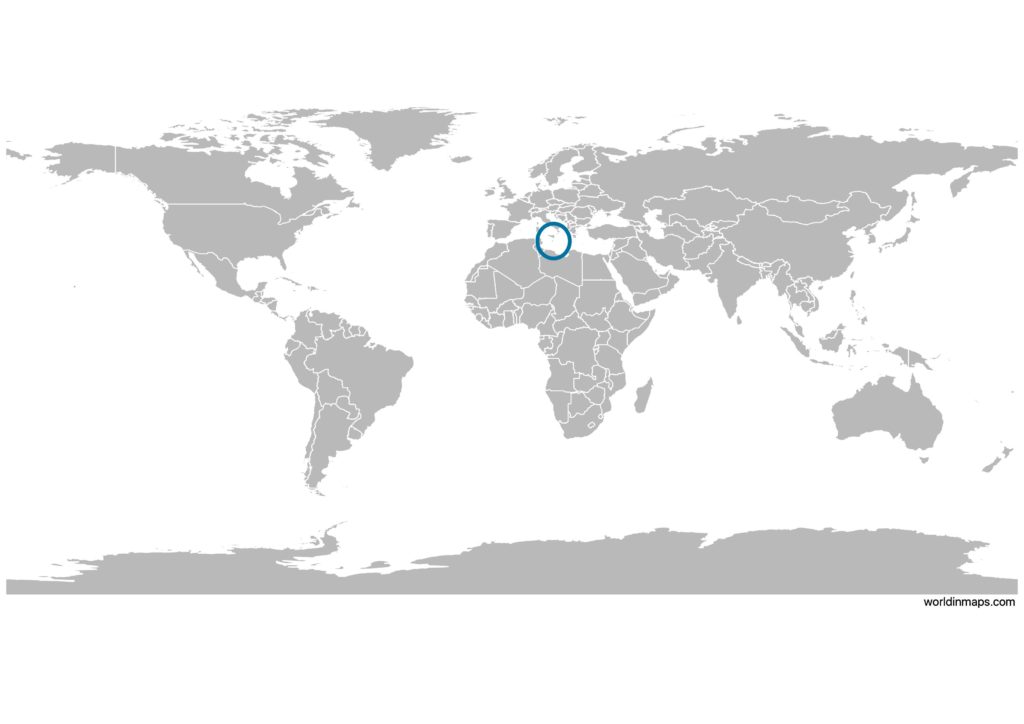
Malta on the world map
Malta top 10 largest cities (2014)
- Qormi (16,779)
- Żabbar (15,404)
- Żebbuġ (11,903)
- Żejtun (11,508)
- Siġġiewi (8,367)
- Rabat (6,901)
- Valletta (6,444)
- Bormla (5,395)
- Senglea (2,784)
- Birgu (2,629)
Demography
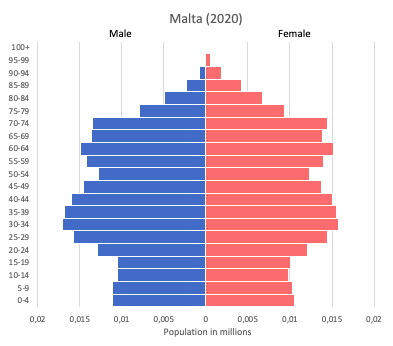
Population pyramid
Age structure data
Estimate for 2020:
- 0-14 years: 14.38% (male 33,934/female 31,823)
- 15-24 years: 10.33% (male 24,445/female 22,811)
- 25-54 years: 41.1% (male 97,685/female 90,264)
- 55-64 years: 12.88% (male 29,533/female 29,353)
- 65 years and over: 21.3% (male 44,644/female 52,775)
Remark: the age structure of a population affects a nation’s key socioeconomic issues. Countries with young populations (high percentage under age 15) need to invest more in schools, while countries with older populations (high percentage ages 65 and over) need to invest more in the health sector. The age structure can also be used to help predict potential political issues. For example, the rapid growth of a young adult population unable to find employment can lead to unrest.
Population from 1950 to 2020
Source: United Nations, Department of Economic and Social Affairs, Population Division (2019). World Population Prospects 2019, Online Edition. Rev. 1.
Evolution of the life expectancy from 1960 to 2018
Source: World Development Indicators, The World Bank
Economy
Agriculture:
potatoes, cauliflower, grapes, wheat, barley, tomatoes, citrus, cut flowers, green peppers, pork, milk, poultry, eggs
Industries:
tourism, electronics, ship building and repair, construction, food and beverages, pharmaceuticals, footwear, clothing, tobacco, aviation services, financial services, information technology services
Exports – commodities:
machinery and mechanical appliances, mineral fuels, oils and petroleum products, pharmaceutical products, books and newspapers, aircraft/spacecraft and parts, toys, games, and sports equipment
Imports – commodities:
mineral fuels, oils and products; electrical machinery, aircraft/spacecraft and parts thereof, machinery and mechanical appliances, plastic and other semi-manufactured goods, vehicles and parts
Time zone and current time in Malta
Go to our interactive map to get the current time in Malta