Singapore

| Government | |
| Name | Republic of Singapore |
| Government type | parliamentary republic |
| Capital | Singapore (city – state) |
| Currency | Singapore dollar (SGD) |
| Organization | |
| Member State | Commonwealth of Nations |
| People | |
| Population (2020) | 5,850,343 (115th) |
| Density of population | 7,804 P/km2 (2nd) |
| Nationality | Singaporean |
| Official languages | |
| English | |
| Mandarin | |
| Malay | |
| Tamil | |
| Ethnic groups (2018) | |
| Chinese | 74.3% |
| Malay | 13.4% |
| Indian | 9% |
| other | 3.2% |
| Religions (2015) | |
| Buddhist | 33.2% |
| Christian | 18.8% |
| Muslim | 14% |
| Taoist | 10% |
| Hindu | 5% |
| other | 0.6% |
| none | 18.5% |
| Life expectancy (2020) | |
| Male | 83.3 years |
| Female | 88.9 years |
| Total population | 86 years (3rd) |
| Homicides | |
| Total (2018) | 0.2 per 100,000 people (173rd) |
| Geography | |
| Land area | 709.2 km2 |
| water area | 10 km2 |
| total area | 719.2 km2 (191st) |
| Lowest point | |
| Singapore Strait | 0 m |
| Highest point | |
| Bukit Timah | 166 m |
| Land use (2011) | |
| Agricultural land | 1% |
| Arable land | 0.9% |
| Permanent crops | 0.1% |
| Permanent pasture | 0% |
| Forest | 3.3% |
| Other | 95.7% |
| Urbanization | |
| Urban population (2020) | 100% |
| Rate of urbanization | 1.39% annual rate of change (2015 – 2020) |
| Economy | |
| Labor force (2017) | 3.657 million (99th) |
| note: excludes non-residents | |
| Labor force by occupation (2017) | |
| Agriculture | 0.7% |
| Industry | 25.6% |
| Services | 73.7% |
| note: excludes non-residents | |
| Unemployment rate (2017) | 2.2% (21st) |
| GDP (PPP) (estimate 2020) | |
| Total | $615.698 billion (36th) |
| Per capita | $107,604 (3rd) |
| GDP (nominal) (estimate 2020) | |
| Total | $391.875 billion (31st) |
| Per capita | $68,487 (7th) |
| GDP by sector (estimate 2017) | |
| Agriculture | 0% |
| Industry | 24.8% |
| Services | 75.2% |
| Exports (2017) | $396.8 billion (13th) |
| Exports partners (2017) | |
| China | 14.7% |
| Hong Kong | 12.6% |
| Malaysia | 10.8% |
| US | 6.6% |
| Indonesia | 5.8% |
| Japan | 4.7% |
| South Korea | 4.6% |
| Thailand | 4% |
| Imports (2017) | $312.1 billion (16th) |
| Imports partners (2017) | |
| China | 13.9% |
| Malaysia | 12% |
| US | 10.7% |
| Japan | 6.3% |
| South Korea | 5% |
Singapore on the world map
Demography
Population pyramid
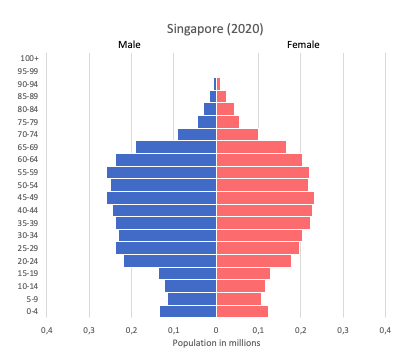
Age structure data
Estimate for 2020:
- 0-14 years: 12.8% (male 406,983/female 387,665)
- 15-24 years: 15.01% (male 457,190/female 474,676)
- 25-54 years: 50.73% (male 1,531,088/female 1,618,844)
- 55-64 years: 10.58% (male 328,024/female 328,808)
- 65 years and over: 10.89% (male 310,123/female 366,259)
Remark: the age structure of a population affects a nation’s key socioeconomic issues. Countries with young populations (high percentage under age 15) need to invest more in schools, while countries with older populations (high percentage ages 65 and over) need to invest more in the health sector. The age structure can also be used to help predict potential political issues. For example, the rapid growth of a young adult population unable to find employment can lead to unrest.
Population from 1950 to 2020
Source: United Nations, Department of Economic and Social Affairs, Population Division (2019). World Population Prospects 2019, Online Edition. Rev. 1.
Evolution of the life expectancy from 1960 to 2018
Source: World Development Indicators, The World Bank
Economy
Agriculture:
vegetables, poultry, eggs, fish, ornamental fish, orchids
Industries:
electronics, chemicals, financial services, oil drilling equipment, petroleum refining, biomedical products, scientific instruments, telecommunication equipment, processed food and beverages, ship repair, offshore platform construction, entrepot trade
Exports – commodities:
machinery and equipment (including electronics and telecommunications), pharmaceuticals and other chemicals, refined petroleum products, foodstuffs and beverages
Imports – commodities:
machinery and equipment, mineral fuels, chemicals, foodstuffs, consumer goods
Time zone and current time in Singapore
Go to our interactive map to get the current time in Singapore