Peru
| Government | |
| Name | Republic of Peru |
| Spanish | República del Perú |
| Government type | presidential republic |
| Capital | Lima (9,735,587 (2014)) |
| Currency | Sol (PEN) |
| People | |
| Population (2020) | 32,971,846 (42nd) |
| Density of population | 23 P/km2 (198th) |
| Nationality | Peruvian |
| Official languages | |
| Spanish | |
| Quechua | |
| Aymara | |
| Ethnic groups (2017) | |
| mestizo (mixed Amerindian and white) | 60.2% |
| Amerindian | 25.8% |
| white | 5.9% |
| African descent | 3.6% |
| other | 1.2% |
| unspecified | 3.3% |
| Religions (2017) | |
| Roman Catholic | 60% |
| Christian | 14.6% |
| evangelical | 11.1% |
| other | 3.5% |
| other | 0.3% |
| none | 4% |
| unspecified | 21.1% |
| Life expectancy (2020) | |
| Male | 72.6 years |
| Female | 76.9 years |
| Total population | 74.7 years (127th) |
| Homicides | |
| Total (2017) | 7.9 per 100,000 people (41st) |
| Geography | |
| Land area | 1,279,996 km2 |
| water area | 5,220 km2 |
| total area | 1,285,216 km2 (21st) |
| Mean elevation | 1,555 m |
| Lowest point | |
| Pacific Ocean | 0 m |
| Highest point | |
| Nevado Huascaran | 6,746 m |
| Land use (2011) | |
| Agricultural land | 18.8% |
| Arable land | 3.1% |
| Permanent crops | 1.1% |
| Permanent pasture | 14.6% |
| Forest | 53% |
| Other | 28.2% |
| Urbanization | |
| Urban population (2020) | 78.3% |
| Rate of urbanization | 1.44% annual rate of change (2015 – 2020) |
| Economy | |
| Labor force (2017) | 17.03 million (36th) |
| note: individuals older than 14 years of age | |
| Labor force by occupation (2011) | |
| Agriculture | 25.8% |
| Industry | 17.4% |
| Services | 56.8% |
| Unemployment rate (2017) | 6.9% (104th) |
| note: data are for metropolitan Lima widespread underemployment | |
| GDP (PPP) (estimate 2020) | |
| Total | $505.450 billion (36th) |
| Per capita | $15,399 (85th) |
| GDP (nominal) (estimate 2020) | |
| Total | $240.175 billion (41st) |
| Per capita | $7,317 (80th) |
| GDP by sector (estimate 2017) | |
| Agriculture | 7.6% |
| Industry | 32.7% |
| Services | 59.9% |
| Exports (2017) | $44.92 billion (53rd) |
| Exports partners (2017) | |
| China | 26.5% |
| US | 15.2% |
| Switzerland | 5.2% |
| South Korea | 4.4% |
| Spain | 4.1% |
| India | 4.1% |
| Imports (2017) | $38.65 billion (61st) |
| Imports partners (2017) | |
| China | 22.3% |
| US | 20.1% |
| Brazil | 6% |
| Mexico | 4.4% |
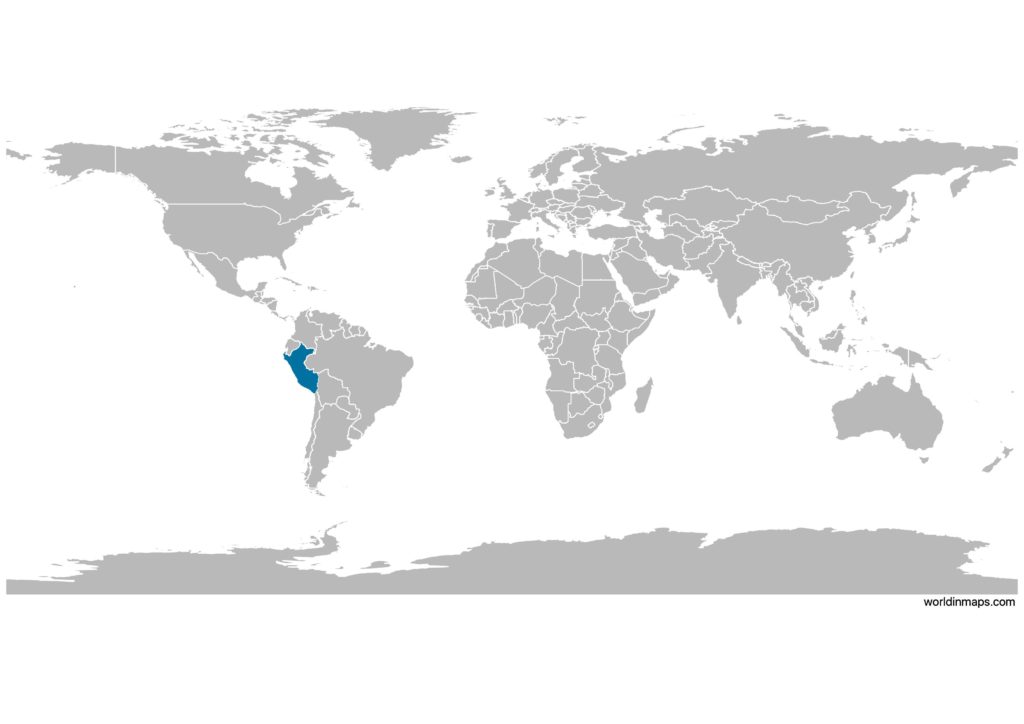
Peru on the world map
Peru top 10 largest cities (2014)
- Lima (9,735,587)
- Arequipa (989.919)
- Trujillo (935.147)
- Chiclayo (801.580)
- Huancayo (501.384)
- Iquitos (432.476)
- Piura (430.319)
- Cusco (420.137)
- Chimbote (367.850)
- Tacna (288.698)
Demography
Population pyramid
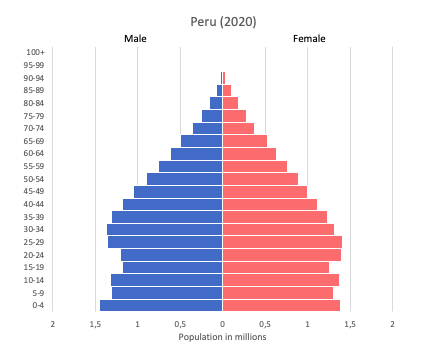
Age structure data
Estimate for 2020:
- 0-14 years: 25.43% (male 4,131,985/female 3,984,546)
- 15-24 years: 17.21% (male 2,756,024/female 2,736,394)
- 25-54 years: 41.03% (male 6,279,595/female 6,815,159)
- 55-64 years: 8.28% (male 1,266,595/female 1,375,708)
- 65 years and over: 8.05% (male 1,207,707/female 1,361,276)
Remark: the age structure of a population affects a nation’s key socioeconomic issues. Countries with young populations (high percentage under age 15) need to invest more in schools, while countries with older populations (high percentage ages 65 and over) need to invest more in the health sector. The age structure can also be used to help predict potential political issues. For example, the rapid growth of a young adult population unable to find employment can lead to unrest.
Population from 1950 to 2020
Source: United Nations, Department of Economic and Social Affairs, Population Division (2019). World Population Prospects 2019, Online Edition. Rev. 1.
Evolution of the life expectancy from 1960 to 2018
Source: World Development Indicators, The World Bank
Economy
Agriculture:
artichokes, asparagus, avocados, blueberries, coffee, cocoa, cotton, sugarcane, rice, potatoes, corn, plantains, grapes, oranges, pineapples, guavas, bananas, apples, lemons, pears, coca, tomatoes, mangoes, barley, medicinal plants, quinoa, palm oil, marigolds, onions, wheat, dry beans; poultry, beef, pork, dairy products, guinea pigs, fish
Industries:
mining and refining of minerals, steel, metal fabrication, petroleum extraction and refining, natural gas and natural gas liquefaction, fishing and fish processing, cement, glass, textiles, clothing, food processing, beer, soft drinks, rubber, machinery, electrical machinery, chemicals, furniture
Exports – commodities:
copper, gold, lead, zinc, tin, iron ore, molybdenum, silver, crude petroleum and petroleum products, natural gas, coffee, asparagus and other vegetables, fruit, apparel and textiles, fishmeal, fish, chemicals, fabricated metal products and machinery, alloys
Imports – commodities:
petroleum and petroleum products, chemicals, plastics, machinery, vehicles, TV sets, power shovels, front-end loaders, telephones and telecommunication equipment, iron and steel, wheat, corn, soybean products, paper, cotton, vaccines and medicines
Time zone and current time in Peru
Go to our interactive map to get the current time in Peru