Philippines

| Government | |
| Name | Republic of the Philippines |
| Filipino | Republika ng Pilipinas |
| Government type | presidential republic |
| Capital | Manila (1,780,148 (2015)) |
| Currency | Philippine Peso (PHP) |
| People | |
| Population (2020) | 109,581,085 (13th) |
| Density of population | 336 P/km2 (47th) |
| Nationality | Filipino |
| Official languages | |
| Filipino | |
| English | |
| Ethnic groups (2010) | |
| Tagalog | 24.4% |
| Bisaya / Binisaya | 11.4% |
| Cebuano | 9.9% |
| Ilocano | 8.8% |
| Hiligaynon / Ilonggo | 8.4% |
| Bikol / Bicol | 6.8% |
| Waray | 4% |
| other local ethnicity | 26.1% |
| other foreign ethnicity | 0.1% |
| Religions (2010) | |
| Roman Catholic | 80.6% |
| Protestant | 8.2% |
| Philippine Council of Evangelical Churches | 2.7% |
| National Council of Churches in the Philippines | 1.2% |
| other Protestant | 4.3% |
| other Christian | 3.4% |
| Muslim | 5.6% |
| tribal religions | 0.2% |
| other | 1.9% |
| none | 0.1% |
| Life expectancy (2020) | |
| Male | 66.5 years |
| Female | 73.8 years |
| Total population | 70 years (166th) |
| Homicides | |
| Total (2018) | 6.5 per 100,000 people (51st) |
| Geography | |
| Land area | 298,170 km2 |
| water area | 1,830 km2 |
| total area | 300,000 km2 (74th) |
| Mean elevation | 442 m |
| Lowest point | |
| Philippine Sea | 0 m |
| Highest point | |
| Mount Apo | 2,954 m |
| Land use (2011) | |
| Agricultural land | 41% |
| Arable land | 18.2% |
| Permanent crops | 17.8% |
| Permanent pasture | 5% |
| Forest | 25.9% |
| Other | 33.1% |
| Urbanization | |
| Urban population (2020) | 47.4% |
| Rate of urbanization | 1.99% annual rate of change (2015 – 2020) |
| Economy | |
| Labor force (2017) | 42.78 million (15th) |
| Labor force by occupation (2017) | |
| Agriculture | 25.4% |
| Industry | 18.3% |
| Services | 56.3% |
| Unemployment rate (2017) | 5.7% (86th) |
| GDP (PPP) (estimate 2020) | |
| Total | $1.110 trillion (27th) |
| Per capita | $10,094 (112th – 2019) |
| GDP (nominal) (estimate 2020) | |
| Total | $383 billion (32nd) |
| Per capita | $3,484 (125th – 2019) |
| GDP by sector (estimate 2017) | |
| Agriculture | 9.6% |
| Industry | 30.6% |
| Services | 59.8% |
| Exports (2017) | $48.2 billion (52nd) |
| Exports partners (2017) | |
| Japan | 16.6% |
| US | 14.6% |
| Hong Kong | 13.7% |
| China | 11% |
| Singapore | 6.1% |
| Thailand | 4.3% |
| Germany | 4.1% |
| South Korea | 4% |
| Imports (2017) | $89.39 billion (39th) |
| Imports partners (2017) | |
| China | 18.1% |
| Japan | 11.4% |
| South Korea | 8.8% |
| US | 7.4% |
| Thailand | 7.1% |
| Indonesia | 6.7% |
| Singapore | 5.9% |
Philippines on the world map
Philippines top 10 largest cities (2015)
- Quezon City (2,936,116)
- Manila (1,780,148)
- Davao City (1,632,588)
- Caloocan (1,583,978)
- Cebu City (922,611)
- Zamboanga City (861,799)
- Taguig (804,915)
- Antipolo (776,386)
- Pasig (755,300)
- Cagayan de Oro (675,950)
Demography
Population pyramid
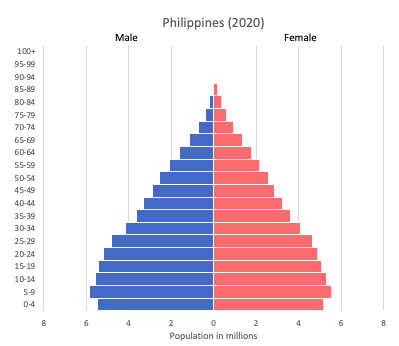
Age structure data
Estimate for 2020:
- 0-14 years: 32.42% (male 18,060,976/female 17,331,781)
- 15-24 years: 19.16% (male 10,680,325/female 10,243,047)
- 25-54 years: 37.37% (male 20,777,741/female 20,027,153)
- 55-64 years: 6.18% (male 3,116,485/female 3,633,301)
- 65 years and over: 4.86% (male 2,155,840/female 3,154,166)
Remark: the age structure of a population affects a nation’s key socioeconomic issues. Countries with young populations (high percentage under age 15) need to invest more in schools, while countries with older populations (high percentage ages 65 and over) need to invest more in the health sector. The age structure can also be used to help predict potential political issues. For example, the rapid growth of a young adult population unable to find employment can lead to unrest.
Population from 1950 to 2020
Source: United Nations, Department of Economic and Social Affairs, Population Division (2019). World Population Prospects 2019, Online Edition. Rev. 1.
Evolution of the life expectancy from 1960 to 2018
Source: World Development Indicators, The World Bank
Economy
Agriculture:
rice, fish, livestock, poultry, bananas, coconut/copra, corn, sugarcane, mangoes, pineapple, cassava
Industries:
semiconductors and electronics assembly, business process outsourcing, food and beverage manufacturing, construction, electric/gas/water supply, chemical products, radio/television/communications equipment and apparatus, petroleum and fuel, textile and garments, non-metallic minerals, basic metal industries, transport equipment
Exports – commodities:
semiconductors and electronic products, machinery and transport equipment, wood manufactures, chemicals, processed food and beverages, garments, coconut oil, copper concentrates, seafood, bananas/fruits
Imports – commodities:
electronic products, mineral fuels, machinery and transport equipment, iron and steel, textile fabrics, grains, chemicals, plastic
Time zone and current time in Philippines
Go to our interactive map to get the current time in Philippines