Congo
| Government | |
| Name | Republic of the Congo |
| French | République du Congo |
| Kongo | Repubilika ya Kôngo |
| Lingala | Republíki ya Kongó |
| Government type | Presidential republic |
| Capital | Brazzaville (1,373,382 (2007)) |
| Currency | Central African CFA franc (XAF) |
| People | |
| Population (2020) | 5,518,092 (117th) |
| Density of population | 12.8 P/km2 (204th) |
| Nationality | Congolese |
| Official languages | |
| French | |
| Ethnic groups | |
| Kongo | 40.5% |
| Teke | 16.9% |
| Sangha | 5.6% |
| M’Bochi | 13.1% |
| Other (African / Europeans) | 23,9% |
| Religions (2010) | |
| Roman Catholic | 33.1% |
| Awakening Churches/Christian Revival | 22.3% |
| Protestant | 19.9% |
| Salutiste | 2.2% |
| Muslim | 1.6% |
| Kimbanguiste | 1.5% |
| Other | 8.1% |
| None | 11.3% |
| Life expectancy (2020) | |
| Male | 59.9 years |
| Female | 62.7 years |
| Total population | 61.3 years (214th) |
| Homicides | |
| n.a. | |
| Geography | |
| Land area | 341,500 km2 |
| water area | 500 km2 |
| total area | 342,000 km2 (65th) |
| Mean elevation | 430 m |
| Lowest point | |
| Atlantic Ocean | 0 m |
| Highest point | |
| Mount Berongou | 903 m |
| Land use (2011) | |
| Agricultural land | 31.1% |
| Arable land | 1.6% |
| Permanent crops | 0.2% |
| Permanent pasture | 29.3% |
| Forest | 65.6% |
| Other | 3.3% |
| Urbanization | |
| Urban population (2020) | 67.8% |
| Rate of urbanization | 3.28% annual rate of change (2015 – 2020) |
| Economy | |
| Labor force (2016) | 2.055 million (124th) |
| Labor force by occupation (2005) | |
| Agriculture | 35.4% |
| Industry | 20.6% |
| Services | 44% |
| Unemployment rate (2014) | 36% (211th) |
| GDP (PPP) (estimate 2019) | |
| Total | $32.516 billion |
| Per capita | $7,119 |
| GDP (nominal) (estimate 2019) | |
| Total | $11.162 billion |
| Per capita | $2,444 |
| GDP by sector (estimate 2017) | |
| Agriculture | 9.3% |
| Industry | 51% |
| Services | 39.7% |
| Exports (2017) | $4.193 billion (114th) |
| Exports partners (2017) | |
| China | 53.8% |
| Angola | 6.2% |
| Gabon | 5.7% |
| Italy | 5.4% |
| Spain | 5.4% |
| Australia | 4.8% |
| Imports (2017) | $2.501 billion (157th) |
| Imports partners (2017) | |
| France | 15% |
| China | 14% |
| Belgium | 12.2% |
| Norway | 8.1% |
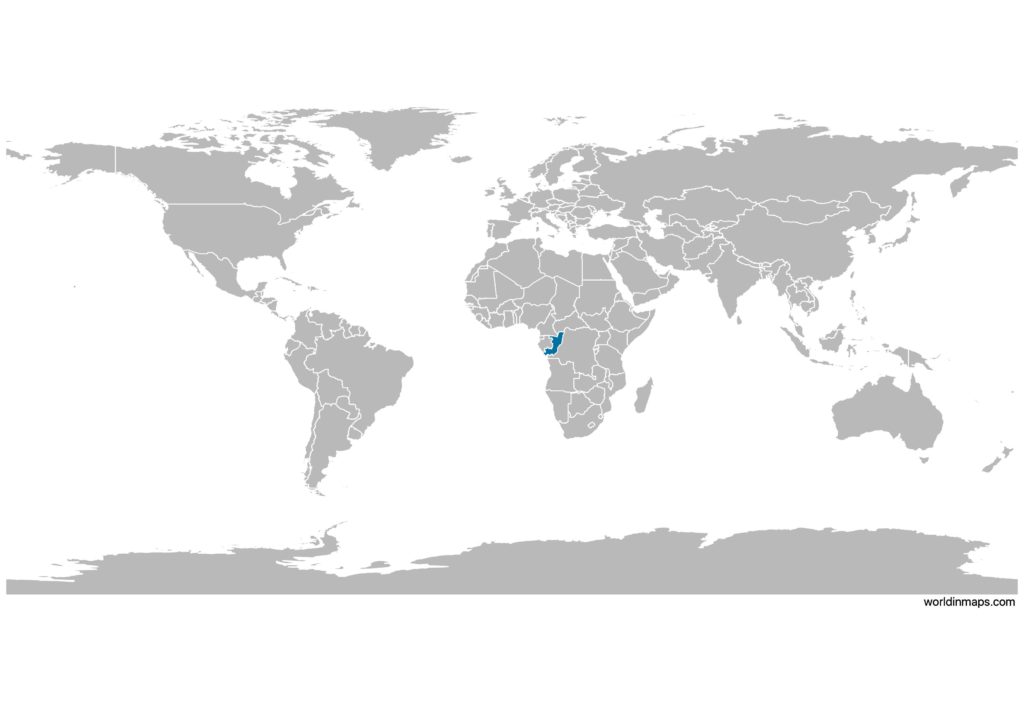
Congo on the world map
Congo top 10 largest cities (2007)
- Brazzaville (1,373,382)
- Pointe-Noire (715,334)
- Dolisie (83,798)
- Nkayi (71,620)
- Kindamba (59,880)
- Impfondo (33,911)
- Ouésso (28,179)
- Madingou (25,713)
- Owando (24,736)
- Sibiti (22,951)
Demography
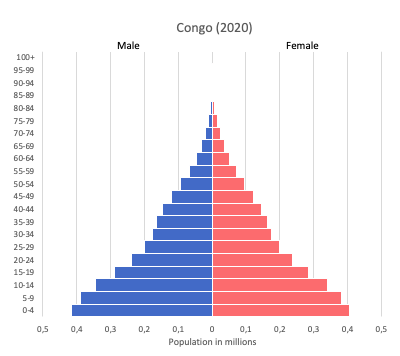
Population pyramid
Age structure data
Estimate for 2020:
- 0-14 years: 41.57% (male 1,110,484/female 1,089,732)
- 15-24 years: 17.14% (male 454,981/female 452,204)
- 25-54 years: 33.5% (male 886,743/female 886,312)
- 55-64 years: 4.59% (male 125,207/female 117,810)
- 65 years and over: 3.2% (male 75,921/female 93,676)
Remark: the age structure of a population affects a nation’s key socioeconomic issues. Countries with young populations (high percentage under age 15) need to invest more in schools, while countries with older populations (high percentage ages 65 and over) need to invest more in the health sector. The age structure can also be used to help predict potential political issues. For example, the rapid growth of a young adult population unable to find employment can lead to unrest.
Population from 1950 to 2020
Source: United Nations, Department of Economic and Social Affairs, Population Division (2019). World Population Prospects 2019, Online Edition. Rev. 1.
Evolution of the life expectancy from 1960 to 2018
Source: World Development Indicators, The World Bank
Economy
Agriculture:
cassava (manioc, tapioca), sugar, rice, corn, peanuts, vegetables, coffee, cocoa, forest products
Industries:
petroleum extraction, cement, lumber, brewing, sugar, palm oil, soap, flour, cigarettes
Exports – commodities:
petroleum, lumber, plywood, sugar, cocoa, coffee, diamonds
Imports – commodities:
capital equipment, construction materials, foodstuffs
Time zone and current time in Congo
Go to our interactive map to get the current time in Congo