Gabon
| Government | |
| Name | Gabonese Republic |
| French | République gabonaise |
| Government type | Presidential republic |
| Capital | Libreville (703,940 (2013)) |
| Currency | Central African CFA franc (XAF) |
| People | |
| Population (2020) | 2,225,728 (146th) |
| Density of population | 5.5 P/km2 (216th) |
| Nationality | Gabonese |
| Official languages | |
| French | |
| Ethnic groups (2012) | |
| Gabonese-born | 80.1% |
| Fang | 23.2% |
| Shira-Punu/Vili | 18.9% |
| Nzabi-Duma | 11.3% |
| Mbede-Teke | 6.9% |
| Myene | 5% |
| Kota-Kele | 4.9% |
| Okande-Tsogo | 2.1% |
| Pygmy | 0.3% |
| Other | 7.5% |
| Cameroonian | 4.6% |
| Malian | 2.4% |
| Beninese | 2.1% |
| Acquired Gabonese nationality | 1.6% |
| Togolese | 1.6% |
| Senegalese | 1.1% |
| Congolese (Brazzaville) | 1% |
| Other | 5.5% |
| Religions (2012) | |
| Roman Catholic | 42.3% |
| Protestant | 12.3% |
| Other Christian | 27.4% |
| Muslim | 9.8% |
| Animist | 0.6% |
| Other | 0.5% |
| None/no answer | 7.1% |
| Life expectancy (2020) | |
| Male | 67.3 years |
| Female | 70.8 years |
| Total population | 69 years (172nd) |
| Homicides | |
| n.a. | |
| Geography | |
| Land area | 257,667 km2 |
| water area | 10,000 km2 |
| total area | 267,667 km2 (78th) |
| Mean elevation | 377 m |
| Lowest point | |
| Atlantic Ocean | 0 m |
| Highest point | |
| Mont Iboundji | 1,575 m |
| Land use (2011) | |
| Agricultural land | 19% |
| Arable land | 1.2% |
| Permanent crops | 0.6% |
| Permanent pasture | 17.2% |
| Forest | 81% |
| Other | 0% |
| Urbanization | |
| Urban population (2020) | 90.1% |
| Rate of urbanization | 2.61% annual rate of change (2015 – 2020) |
| Economy | |
| Labor force (2017) | 557,800 (155th) |
| Labor force by occupation (2005) | |
| Agriculture | 64% |
| Industry | 12% |
| Services | 24% |
| Unemployment rate (2015) | 28% (204th) |
| GDP (PPP) (estimate 2018) | |
| Total | $38.280 billion |
| Per capita | $18,647 |
| GDP (nominal) (estimate 2018) | |
| Total | $17.212 billion |
| Per capita | $8,384 |
| GDP by sector (estimate 2017) | |
| Agriculture | 5% |
| Industry | 44.7% |
| Services | 50.4% |
| Exports (2017) | $5.564 billion (105th) |
| Exports partners (2017) | |
| China | 36.4% |
| US | 10% |
| Ireland | 8.5% |
| Netherlands | 6.3% |
| South Korea | 5.1% |
| Australia | 5% |
| Italy | 4.6 |
| Imports (2017) | $2.829 billion (150th) |
| Imports partners (2017) | |
| France | 23.6% |
| Belgium | 19.6% |
| China | 15.2% |
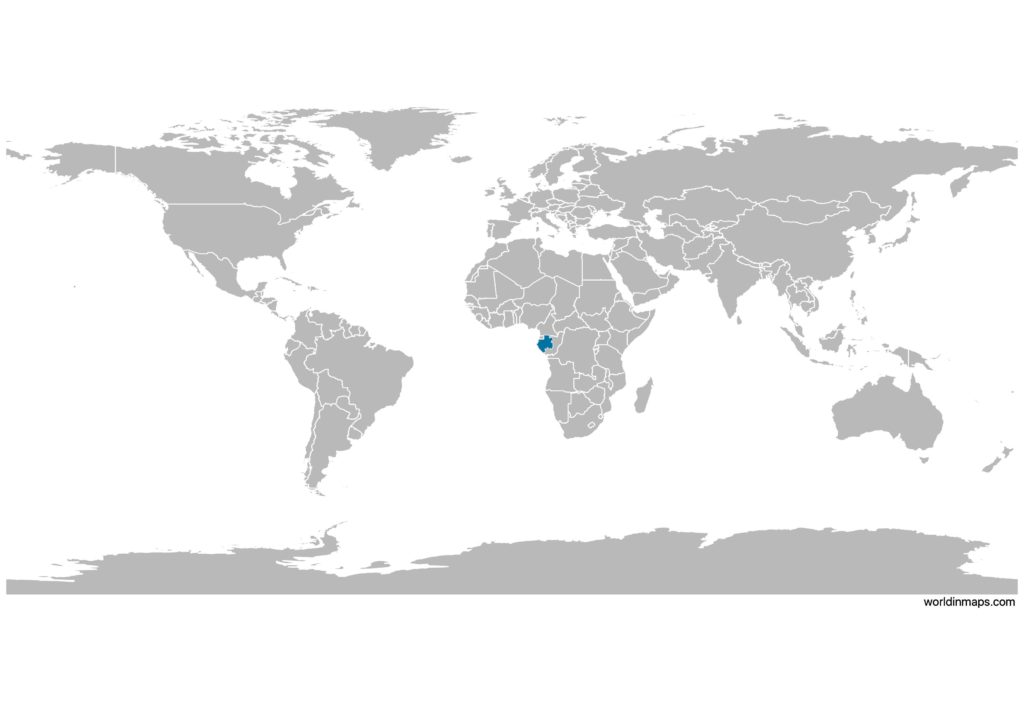
Gabon on the world map
Gabon top 10 largest cities (2013)
- Libreville (703,940)
- Port-Gentil (or Mandji) (136,462)
- Franceville (or Masuku) (110,568)
- Oyem (60,685)
- Moanda (59,154)
- Mouila (36,061)
- Lambaréné (38,775)
- Tchibanga (30,042)
- Koulamoutou (25,651)
- Makokou (20,653)
Demography
Population pyramid
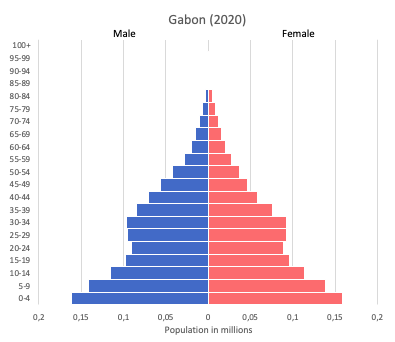
Age structure data
Estimate for 2020:
- 0-14 years: 36.45% (male 413,883/female 399,374)
- 15-24 years: 21.9% (male 254,749/female 233,770)
- 25-54 years: 32.48% (male 386,903/female 337,776)
- 55-64 years: 5.19% (male 58,861/female 56,843)
- 65 years and over: 3.98% (male 44,368/female 44,381)
Remark: the age structure of a population affects a nation’s key socioeconomic issues. Countries with young populations (high percentage under age 15) need to invest more in schools, while countries with older populations (high percentage ages 65 and over) need to invest more in the health sector. The age structure can also be used to help predict potential political issues. For example, the rapid growth of a young adult population unable to find employment can lead to unrest.
Population from 1950 to 2020
Source: United Nations, Department of Economic and Social Affairs, Population Division (2019). World Population Prospects 2019, Online Edition. Rev. 1.
Evolution of the life expectancy from 1960 to 2018
Source: World Development Indicators, The World Bank
Economy
Agriculture:
cocoa, coffee, sugar, palm oil, rubber, cattle, okoume (a tropical softwood), fish
Industries:
petroleum extraction and refining, manganese, gold, chemicals, ship repair, food and beverages, textiles, lumbering and plywood, cement
Exports – commodities:
crude oil, timber, manganese, uranium
Imports – commodities:
machinery and equipment, foodstuffs, chemicals, construction materials
Time zone and current time in Gabon
Go to our interactive map to get the current time in Gabon