Côte d’Ivoire (Ivory Coast)
| Government | |
| Name | Republic of Côte d’Ivoire |
| French | République de Côte d’Ivoire |
| Government type | Presidential republic |
| Legislative capital | Yamoussoukro (212,670 (2014)) |
| Administrative Capital | Abidjan (4,395,243 (2014)) |
| Currency | West African CFA franc (XOF) |
| People | |
| Population (2020) | 26,378,275 (53rd) |
| Density of population | 63.9 P/km2 (139th) |
| Nationality | Ivoirian |
| Official languages | |
| French | |
| Ethnic groups (2014) | |
| Akan | 28.9% |
| Voltaique or Gur | 16.1% |
| Northern Mande | 14.5% |
| Kru | 8.5% |
| Southern Mande | 6.9% |
| Unspecified | 0.9% |
| Non-Ivoirian | 24.2% |
| Religions (2014) | |
| Muslim | 42.9% |
| Catholic | 17.2% |
| Evangelical | 11.8% |
| Methodist | 1.7% |
| Other Christian | 3.2% |
| Animist | 3.6% |
| Other religion | 0.5% |
| None | 19.1% |
| Note: the majority of foreign migrant workers are Muslim (72.7%) and Christian (17.7%) | |
| Life expectancy (2020) | |
| Male | 59.2 years |
| Female | 63.6 years |
| Total population | 61.3 years (215th) |
| Homicides | |
| n.a. | |
| Geography | |
| Land area | 318,003 km2 |
| water area | 4,460 km2 |
| total area | 322,463 km2 (70th) |
| Mean elevation | 250 m |
| Lowest point | |
| Gulf of Guinea | 0 m |
| Highest point | |
| Monts Nimba | 1,752 m |
| Land use (2011) | |
| Agricultural land | 64.8% |
| Arable land | 9.1% |
| Permanent crops | 14.2% |
| Permanent pasture | 41.5% |
| Forest | 32.7% |
| Other | 2.5% |
| Urbanization | |
| Urban population (2020) | 51.7% |
| Rate of urbanization | 3.38% annual rate of change (2015 – 2020) |
| Economy | |
| Labor force (2017) | 8.747 million (59th) |
| Labor force by occupation (2007) | |
| Agriculture | 68% |
| Unemployment rate (2013) | 9.4% (135th) |
| GDP (PPP) (estimate 2020) | |
| Total | $163.594 billion |
| Per capita | $6,201 |
| GDP (nominal) (estimate 2020) | |
| Total | $58.203 billion |
| Per capita | $2,159 |
| GDP by sector (estimate 2017) | |
| Agriculture | 20.1% |
| Industry | 26.6% |
| Services | 53.3% |
| Exports (2017) | $11.74 billion (161st) |
| Exports partners (2017) | |
| Netherlands | 11.8% |
| US | 7.9% |
| France | 6.4% |
| Belgium | 6.4% |
| Germany | 5.8% |
| Burkina Faso | 4.5% |
| India | 4.4% |
| Mali | 4.2% |
| Imports (2017) | $9.447 billion (104th) |
| Imports partners (2017) | |
| Nigeria | 15% |
| France | 13.4% |
| China | 11.3% |
| US | 4.3% |
Côte d’Ivoire on the world map

Côte d’Ivoire top 10 largest cities (2014)
- Abidjan (4,395,243)
- Bouaké (536,719)
- Daloa (245,360)
- Korhogo (243,048)
- Yamoussoukro (212,670)
- San-Pédro (164,944)
- Gagnoa (160,465)
- Man (149,041)
- Divo (105,397)
- Anyama (103,297)
Demography
Population pyramid
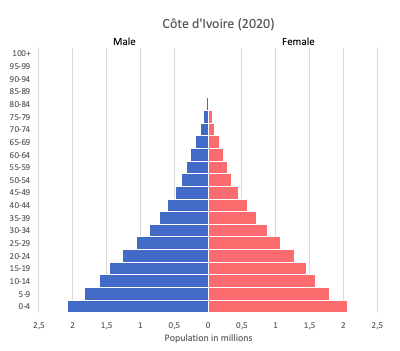
Age structure data
Estimate for 2020:
- 0-14 years: 38.53% (male 5,311,971/female 5,276,219)
- 15-24 years: 20.21% (male 2,774,374/female 2,779,012)
- 25-54 years: 34.88% (male 4,866,957/female 4,719,286)
- 55-64 years: 3.53% (male 494,000/female 476,060)
- 65 years and over: 2.85% (male 349,822/female 433,385)
Remark: the age structure of a population affects a nation’s key socioeconomic issues. Countries with young populations (high percentage under age 15) need to invest more in schools, while countries with older populations (high percentage ages 65 and over) need to invest more in the health sector. The age structure can also be used to help predict potential political issues. For example, the rapid growth of a young adult population unable to find employment can lead to unrest.
Population from 1950 to 2020
Source: United Nations, Department of Economic and Social Affairs, Population Division (2019). World Population Prospects 2019, Online Edition. Rev. 1.
Evolution of the life expectancy from 1960 to 2018
Source: World Development Indicators, The World Bank
Economy
Agriculture:
coffee, cocoa beans, bananas, palm kernels, corn, rice, cassava (manioc, tapioca), sweet potatoes, sugar, cotton, rubber; timber
Industries:
foodstuffs, beverages, wood products, oil refining, gold mining, truck and bus assembly, textiles, fertilizer, building materials, electricity
Exports – commodities:
cocoa, coffee, timber, petroleum, cotton, bananas, pineapples, palm oil, fish
Imports – commodities:
fuel, capital equipment, foodstuffs
Time zone and current time in Côte d’Ivoire
Go to our interactive map to get the current time in Côte d’Ivoire