Burkina Faso
| Government | |
| Name | People’s Republic of Burkina |
| Government type | Presidential republic |
| Capital | Ouagadougou (1,475,223 (2006)) |
| Currency | West African CFA (XOF) |
| People | |
| Population (2020) | 20,903,278 (59th) |
| Density of population | 64 P/km2 (137th) |
| Nationality | Burkinabe |
| Official languages | |
| French | |
| Ethnic groups (2010) | |
| Mossi | 52% |
| Fulani | 8.4% |
| Gurma | 7% |
| Bobo | 4.9% |
| Gurunsi | 4.6% |
| Senufo | 4.5% |
| Bissa | 3.7% |
| Lobi | 2.4% |
| Dagara | 2.4% |
| Tuareg/Bella | 1.9% |
| Dioula | 0.8% |
| Unspecified/no answer | 0.3% |
| Other | 7.2% |
| Religions (2010) | |
| Muslim | 61.5% |
| Roman Catholic | 23.3% |
| Traditional/animist | 7.8% |
| Protestant | 6.5% |
| Other/no answer | 0.2% |
| None | 0.7% |
| Life expectancy (2020) | |
| Male | 60.9 years |
| Female | 64.5 years |
| Total population | 62.7 years (208th) |
| Homicides | |
| Total (2017) | 1.3 per 100,000 people (128th) |
| Geography | |
| Land area | 273,800 km2 |
| water area | 400 km2 |
| total area | 274,200 km2 (76th) |
| Mean elevation | 297 m |
| Lowest point | |
| Mouhoun (Black Volta) River | 200 m |
| Highest point | |
| Tena Kourou | 749 m |
| Land use (2016) | |
| Agricultural land | 44.2% |
| Arable land | 22% |
| Permanent crops | 37% |
| Permanent pasture | 21.93% |
| Forest | 19.3% |
| Other | 36.5% |
| Urbanization | |
| Urban population (2020) | 30.6% |
| Rate of urbanization | 4.99% annual rate of change (2015 – 2020) |
| Economy | |
| Labor force (2017) note: large part of the male labor force migrates annually to neighboring countries for seasonal employment | 8.501 million (60th) |
| Labor force by occupation (2000) | |
| Agriculture | 90% |
| Industry and services | 10% |
| Unemployment rate (2004) | 77% (218th) |
| GDP (PPP) (estimate 2020) | |
| Total | $45.339 billion |
| Per capita | $2,207 |
| GDP (nominal) (estimate 2020) | |
| Total | $16.226 billion |
| Per capita | $792 |
| GDP by sector (estimate 2017) | |
| Agriculture | 31% |
| Industry | 23.9% |
| Services | 44.9% |
| Exports (2017) | $3.14 billion (128th) |
| Exports partners (2017) | |
| Switzerland | 44.9% |
| India | 15.6% |
| South Africa | 11.3% |
| Cote d’Ivoire | 4.9% |
| Imports (2017) | $3.305 billion (144th) |
| Imports partners (2017) | |
| China | 13.2% |
| Cote d’Ivoire | 9.5% |
| US | 8.2% |
| Thailand | 8.1% |
| France | 6.5% |
| Ghana | 4.4% |
| Togo | 4.1% |
| India | 4.3 |
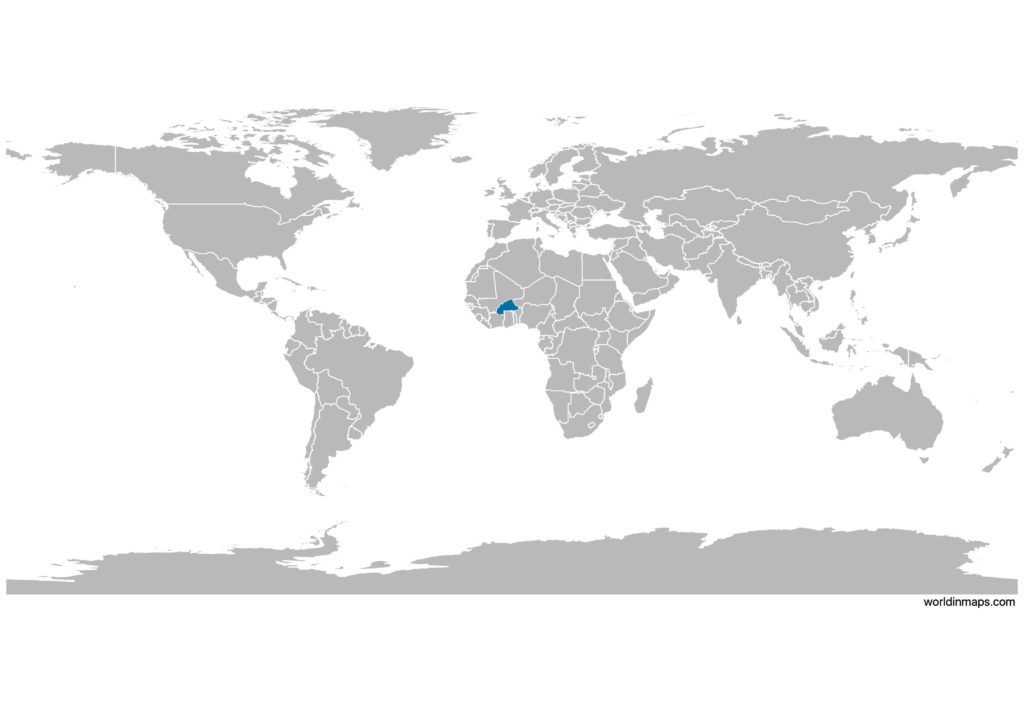
Burkina Faso on the world map
Burkina Faso top 10 largest cities (2006)
- Ouagadougou (1,475,223)
- Bobo-Dioulasso (489,967)
- Koudougou (88,184)
- Banfora (75,917)
- Ouahigouya (73,153)
- Pouytenga (60,618)
- Kaya (54,365)
- Tenkodogo (44,491)
- Fada N’gourma (41,785)
- Houndé (39,458)
Demography
Population pyramid
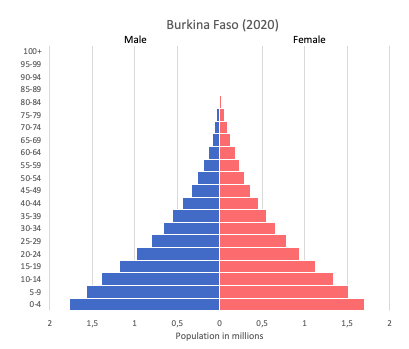
Age structure data
Estimate for 2020:
- 0-14 years: 43.58% (male 4,606,350/female 4,473,951)
- 15-24 years: 20.33% (male 2,121,012/female 2,114,213)
- 25-54 years: 29.36% (male 2,850,621/female 3,265,926)
- 55-64 years: 3.57% (male 321,417/female 423,016)
- 65 years and over: 3.16% (male 284,838/female 374,057)
Remark: the age structure of a population affects a nation’s key socioeconomic issues. Countries with young populations (high percentage under age 15) need to invest more in schools, while countries with older populations (high percentage ages 65 and over) need to invest more in the health sector. The age structure can also be used to help predict potential political issues. For example, the rapid growth of a young adult population unable to find employment can lead to unrest.
Population from 1950 to 2020
Source: United Nations, Department of Economic and Social Affairs, Population Division (2019). World Population Prospects 2019, Online Edition. Rev. 1.
Evolution of the life expectancy from 1960 to 2018
Source: World Development Indicators, The World Bank
Economy
Agriculture:
cotton, peanuts, shea nuts, sesame, sorghum, millet, corn, rice, livestock
Industries:
cotton lint, beverages, agricultural processing, soap, cigarettes, textiles, gold
Exports – commodities:
gold, cotton, livestock
Imports – commodities:
capital goods, foodstuffs, petroleum
Time zone and current time in Burkina Faso
Go to our interactive map to get the current time in Burkina Faso