Cuba
| Government | |
| Name | Republic of Cuba |
| Spanish | República de Cuba |
| Government type | Communist state |
| Capital | Havana (2,131,480 (2018)) |
| Currency | Peso (CUP) and Convertible peso (CUC) |
| People | |
| Population (2020) | 11,326,616 (82nd) |
| Density of population | 101.9 P/km2 (81st) |
| Nationality | Cuban |
| Official languages | |
| Spanish | |
| Ethnic groups (2012) | |
| White | 64.1% |
| Mulatto or mixed | 26.6% |
| Black | 9.3% |
| Religions (2010) | |
| Christian | 59.2% |
| Folk (includes religions of African origin, spiritualism, and others intermingled with Catholicism or Protestantism) | 17.4% |
| Other | 0.4% |
| None | 23% |
| Life expectancy (2020) | |
| Male | 76.8 years |
| Female | 81.7 years |
| Total population | 79.2 years (59th) |
| Homicides | |
| Total (2016) | 5.0 per 100,000 people (63rd) |
| Geography | |
| Land area | 109,820 km2 |
| water area | 1,040 km2 |
| total area | 110,860 km2 (107th) |
| Mean elevation | 108 m |
| Lowest point | |
| Caribbean Sea | 0 m |
| Highest point | |
| Pico Turquino | 1,974 m |
| Land use (2011) | |
| Agricultural land | 60.3% |
| Arable land | 33.8% |
| Permanent crops | 3.6% |
| Permanent pasture | 22.9% |
| Forest | 27.3% |
| Other | 12.4% |
| Urbanization | |
| Urban population (2020) | 77.2% |
| Rate of urbanization | 0.14% annual rate of change (2015 – 2020) |
| Economy | |
| Labor force (2017) | 4.691 million (86th) |
| State sector | 72.3% |
| Non-state sector | 27.7% |
| Labor force by occupation (2016) | |
| Agriculture | 18% |
| Industry | 10% |
| Services | 72% |
| Unemployment rate (2017) (unofficial estimates are about double) | 2.6% (27th) |
| GDP (PPP) (estimate 2015) | |
| Total | $254.865 billion |
| Per capita | $22,237 |
| GDP (nominal) (estimate 2018) | |
| Total | $100.023 billion (62nd) |
| Per capita | $8,822 (78th) |
| GDP by sector (estimate 2017) | |
| Agriculture | 4% |
| Industry | 22.7% |
| Services | 73.4% |
| Exports (2017) | $2.63 billion (131st) |
| Exports partners (2017) | |
| Venezuela | 17.8% |
| Spain | 12.2% |
| Russia | 7.9% |
| Lebanon | 6.1% |
| Indonesia | 4.5% |
| Germany | 4.3% |
| Imports (2017) | $11.06 billion (98th) |
| Imports partners (2017) | |
| China | 22% |
| Spain | 14% |
| Russia | 5% |
| Brazil | 5% |
| Mexico | 4.9% |
| Italy | 4.8% |
| US | 4.5% |
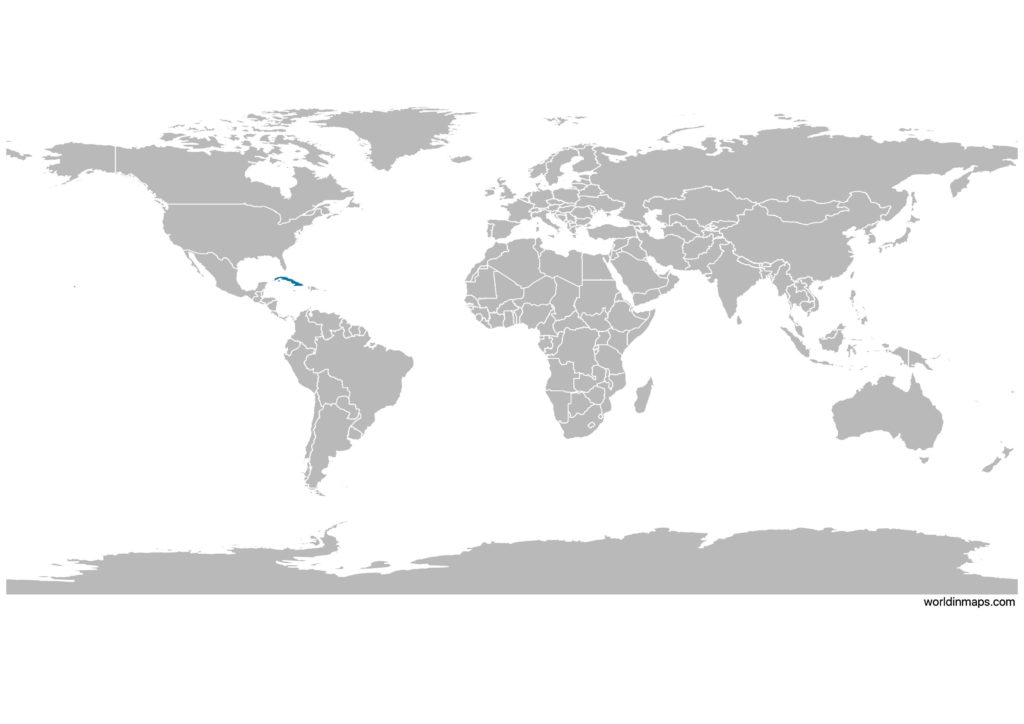
Cuba on the world map
Cuba top 10 largest cities (2018)
- Havana (2,131,480)
- Santiago de Cuba (433,581)
- Camagüey (308,902)
- Holguín (297,433)
- Santa Clara (216,854)
- Guantánamo (216,003)
- Victoria de Las Tunas (173,552)
- Bayamo (159,966)
- Cienfuegos (151,838)
- Pinar del Río (145,193)
Demography
Population pyramid
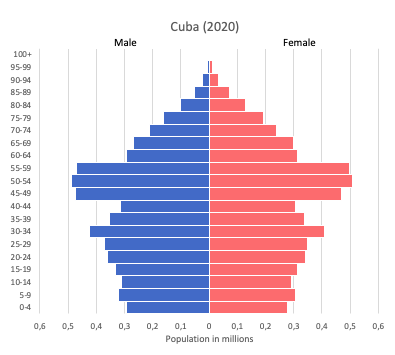
Age structure data
Estimate for 2020:
- 0-14 years: 16.34% (male 929,927/female 877,035)
- 15-24 years: 11.81% (male 678,253/female 627,384)
- 25-54 years: 41.95% (male 2,335,680/female 2,303,793)
- 55-64 years: 14.11% (male 760,165/female 799,734)
- 65 years and over: 15.8% (male 794,743/female 952,348)
Remark: the age structure of a population affects a nation’s key socioeconomic issues. Countries with young populations (high percentage under age 15) need to invest more in schools, while countries with older populations (high percentage ages 65 and over) need to invest more in the health sector. The age structure can also be used to help predict potential political issues. For example, the rapid growth of a young adult population unable to find employment can lead to unrest.
Population from 1950 to 2020
Source: United Nations, Department of Economic and Social Affairs, Population Division (2019). World Population Prospects 2019, Online Edition. Rev. 1.
Evolution of the life expectancy from 1960 to 2018
Source: World Development Indicators, The World Bank
Economy
Agriculture:
sugar, tobacco, citrus, coffee, rice, potatoes, beans, livestock
Industries:
petroleum, nickel, cobalt, pharmaceuticals, tobacco, construction, steel, cement, agricultural machinery, sugar
Exports – commodities:
petroleum, nickel, medical products, sugar, tobacco, fish, citrus, coffee
Imports – commodities:
petroleum, food, machinery and equipment, chemicals
Time zone and current time in Cuba
Go to our interactive map to get the current time in Cuba