Liberia
| Government | |
| Name | Republic of Liberia |
| Government type | presidential republic |
| Capital | Monrovia (1,021,762 (2008)) |
| Currency | Liberian dollar (LRD) |
| People | |
| Population (2020) | 5,057,677 (126th) |
| Density of population | 40.43 P/km2 (180th) |
| Nationality | Liberian |
| Official languages | |
| English | |
| Ethnic groups (2008) | |
| Kpelle | 20.3% |
| Bassa | 13.4% |
| Grebo | 10% |
| Gio | 8% |
| Mano | 7.9% |
| Kru | 6% |
| Lorma | 5.1% |
| Kissi | 4.8% |
| Gola | 4.4% |
| Krahn | 4% |
| Vai | 4% |
| Mandingo | 3.2% |
| Gbandi | 3% |
| Mende | 1.3% |
| Sapo | 1.3% |
| other Liberian | 1.7% |
| other African | 1.4% |
| non-African | .1% |
| Religions (2008) | |
| Christian | 85.6% |
| Muslim | 12.2% |
| Traditional | 0.6% |
| other | 0.2% |
| none | 1.5% |
| Life expectancy (2020) | |
| Male | 62.5 years |
| Female | 67 years |
| Total population | 64.7 years (200th) |
| Homicides | |
| Total (2012) | 3.3 per 100,000 people (78th) |
| Geography | |
| Land area | 96,320 km2 |
| water area | 15,049 km2 |
| total area | 111,369 km2 (105th) |
| Mean elevation | 243 m |
| Lowest point | |
| Atlantic Ocean | 0 m |
| Highest point | |
| Mount Wuteve | 1,447 m |
| Land use (2011) | |
| Agricultural land | 28.1% |
| Arable land | 5.2% |
| Permanent crops | 2.1% |
| Permanent pasture | 20.8% |
| Forest | 44.6% |
| Other | 27.3% |
| Urbanization | |
| Urban population (2020) | 52.1% |
| Rate of urbanization | 3.41% annual rate of change (2015 – 2020) |
| Economy | |
| Labor force (2017) | 1.677 million (128th) |
| Labor force by occupation (2000) | |
| Agriculture | 70% |
| Industry | 8% |
| Services | 22% |
| Unemployment rate (2014) | 2.8% (31st) |
| GDP (PPP) (estimate 2019) | |
| Total | $6.468 billion |
| Per capita | $1,413 |
| GDP (nominal) (estimate 2019) | |
| Total | $3.221 billion |
| Per capita | $704 |
| GDP by sector (estimate 2017) | |
| Agriculture | 34% |
| Industry | 13.8% |
| Services | 52.2% |
| Exports (2017) | $260.6 billion (185th) |
| Exports partners (2017) | |
| Germany | 36.2% |
| Switzerland | 14.2% |
| UAE | 8.8% |
| US | 6.8% |
| Indonesia | 4.7% |
| Imports (2017) | $1.166 billion (179th) |
| Imports partners (2017) | |
| Singapore | 29.8% |
| China | 24.4% |
| South Korea | 17.5% |
| Japan | 9.4% |
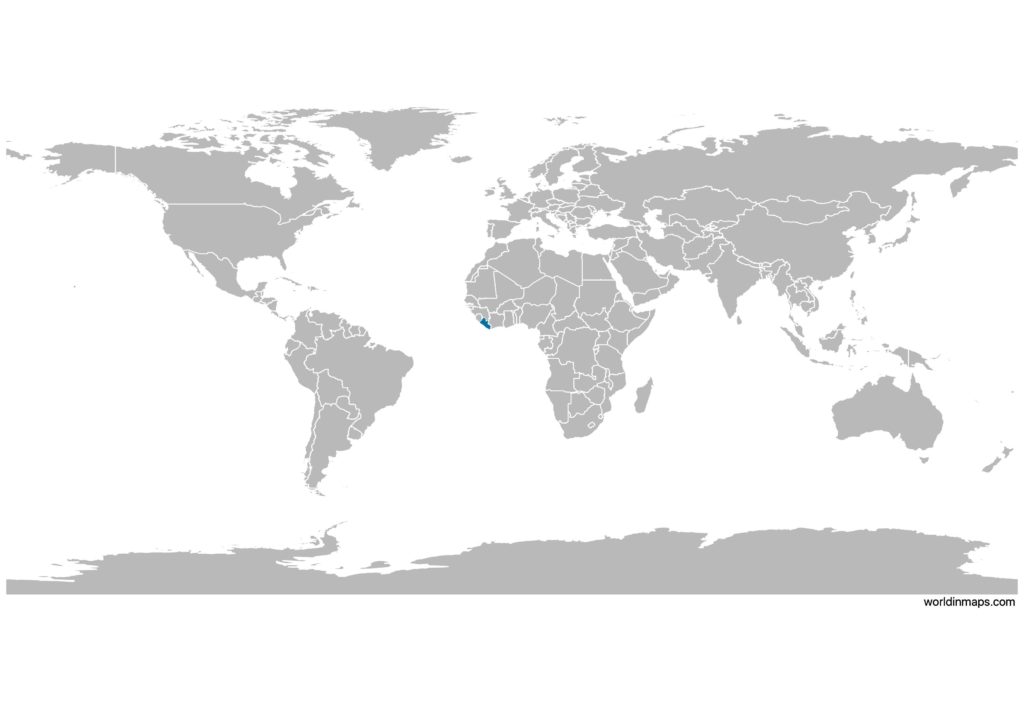
Liberia on the world map
Liberia top 10 largest cities (2008)
- Monrovia (1,021,762)
- Gbarnga (56,986)
- Buchanan (50,245)
- Ganta (42,077)
- Kakata (34,608)
- Zwedru (25,349)
- Harbel (25,309)
- Harper (23,517)
- Pleebo (23,464)
- Foya (20,569)
Demography
Population pyramid
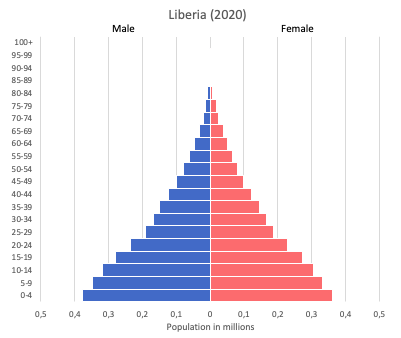
Age structure data
Estimate for 2020:
- 0-14 years: 43.35% (male 1,111,479/female 1,087,871)
- 15-24 years: 20.35% (male 516,136/female 516,137)
- 25-54 years: 30.01% (male 747,983/female 774,615)
- 55-64 years: 3.46% (male 89,150/female 86,231)
- 65 years and over: 2.83% (male 70,252/female 73,442)
Remark: the age structure of a population affects a nation’s key socioeconomic issues. Countries with young populations (high percentage under age 15) need to invest more in schools, while countries with older populations (high percentage ages 65 and over) need to invest more in the health sector. The age structure can also be used to help predict potential political issues. For example, the rapid growth of a young adult population unable to find employment can lead to unrest.
Population from 1950 to 2020
Source: United Nations, Department of Economic and Social Affairs, Population Division (2019). World Population Prospects 2019, Online Edition. Rev. 1.
Evolution of the life expectancy from 1960 to 2018
Source: World Development Indicators, The World Bank
Economy
Agriculture:
rubber, coffee, cocoa, rice, cassava (manioc, tapioca), palm oil, sugarcane, bananas, sheep, goats, timber
Industries:
mining (iron ore and gold), rubber processing, palm oil processing, diamonds
Exports – commodities:
rubber, timber, iron, diamonds, cocoa, coffee
Imports – commodities:
fuels, chemicals, machinery, transportation equipment, manufactured goods; foodstuffs
Time zone and current time in Liberia
Go to our interactive map to get the current time in Liberia