Botswana
| Government | |
| Name | Republic of Botswana |
| Tswana | Lefatshe la Botswana |
| Government type | Parliamentary republic |
| Capital | Gaborone (227,333 (2011)) |
| Currency | Botswana pula (BWP) |
| Organization | |
| Member State | Commonwealth of Nations |
| People | |
| Population (2020) | 2,351,625 (145th) |
| Density of population | 3.7 P/km2 (231st) |
| Nationality | Motswana (singular), Batswana (plural) |
| Official languages | |
| English | |
| Ethnic groups | |
| Tswana (or Setswana) | 79% |
| Kalanga | 11% |
| Basarwa | 3% |
| Other | 7% |
| Religions (2011) | |
| Christian | 79.1% |
| Badimo | 4.1% |
| Other | 1.4% |
| None | 15,2% |
| Unspecified | 0.3% |
| Life expectancy (2020) | |
| Male | 62.8 years |
| Female | 66.9 years |
| Total population | 64.8 years (197th) |
| Homicides | |
| Total (2010) | 15.2 per 100,000 people (23rd) |
| Geography | |
| Land area | 566,730 km2 |
| water area | 15,000 km2 |
| total area | 581,730 km2 (49th) |
| Mean elevation | 1,013 m |
| Lowest point | |
| Junction of the Limpopo and Shashe Rivers | 513 m |
| Highest point | |
| Tsodilo Hills | 1,489 m |
| Land use (2011) | |
| Agricultural land | 45.8% |
| Arable land | 0.6% |
| Permanent crops | 0% |
| Permanent pasture | 45.2% |
| Forest | 19.8% |
| Other | 34.4% |
| Urbanization | |
| Urban population (2020) | 70.9% |
| Rate of urbanization | 2.87% annual rate of change (2015 – 2020) |
| Economy | |
| Labor force (2017) | 1.177 million (141st) |
| Unemployment rate (2013) | 20% (185th) |
| GDP (PPP) (estimate 2019) | |
| Total | $44.3 billion |
| Per capita | $18,654 |
| GDP (nominal) (estimate 2019) | |
| Total | $19.651 billion |
| Per capita | $8,263 |
| GDP by sector (estimate 2017) | |
| Agriculture | 1.8% |
| Industry | 27.5% |
| Services | 70.6% |
| Exports (2017) | $5.934 billion (102nd) |
| Exports partners (2017) | |
| Belgium | 20% |
| India | 12.6% |
| UAE | 12.4% |
| South Africa | 11.9% |
| Singapore | 8.7% |
| Israel | 7% |
| Hong Kong | 4.1% |
| Namibia | 4.1% |
| Imports (2017) | $5.005 billion (128th) |
| Imports partners (2017) | |
| South Africa | 66.1% |
| Canada | 8.3% |
| Israel | 5.3% |
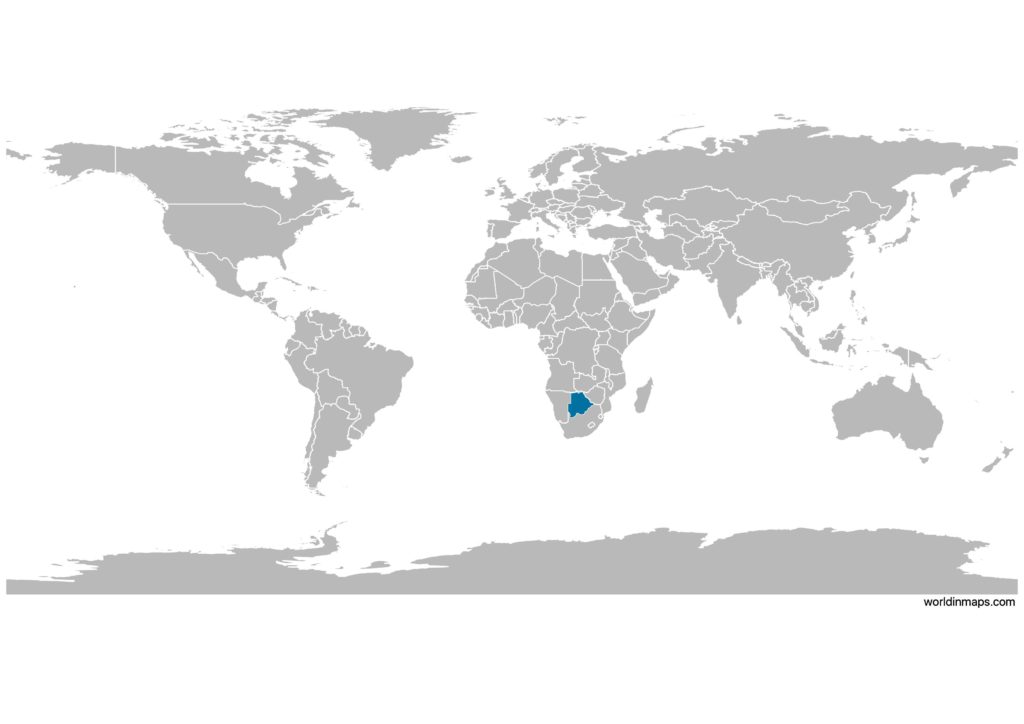
Botswana on the world map
Botswana top 10 largest cities (2011)
- Gaborone (227,333)
- Francistown (100,079)
- Molepolole (67,598)
- Maun (55,784)
- Mogoditshane (57,637)
- Selibe Phikwe (49,724)
- Serowe (47,447)
- Kanye (45,196)
- Mochudi (44,339)
- Mahalapye (41,316)
Demography
Population pyramid
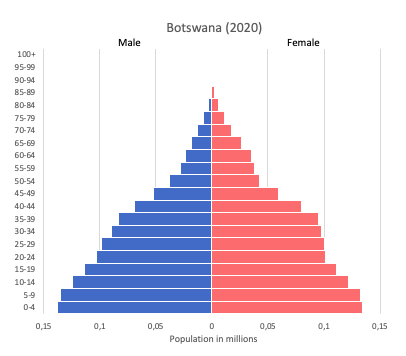
Age structure data
Estimate for 2020:
- 0-14 years: 30.54% (male 357,065/female 350,550)
- 15-24 years: 18.31% (male 208,824/female 215,462)
- 25-54 years: 39.67% (male 434,258/female 484,922)
- 55-64 years: 5.92% (male 59,399/female 77,886)
- 65 years and over: 5.56% (male 53,708/female 75,159)
Remark: the age structure of a population affects a nation’s key socioeconomic issues. Countries with young populations (high percentage under age 15) need to invest more in schools, while countries with older populations (high percentage ages 65 and over) need to invest more in the health sector. The age structure can also be used to help predict potential political issues. For example, the rapid growth of a young adult population unable to find employment can lead to unrest.
Population from 1950 to 2020
Source: United Nations, Department of Economic and Social Affairs, Population Division (2019). World Population Prospects 2019, Online Edition. Rev. 1.
Evolution of the life expectancy from 1960 to 2018
Source: World Development Indicators, The World Bank
Major rivers
Economy
Agriculture:
livestock, sorghum, maize, millet, beans, sunflowers, groundnuts
Industries:
diamonds, copper, nickel, salt, soda ash, potash, coal, iron ore, silver, beef processing, textiles
Exports – commodities:
diamonds, copper, nickel, soda ash, beef, textiles
Imports – commodities:
foodstuffs, machinery, electrical goods, transport equipment, textiles, fuel and petroleum products, wood and paper products, metal and metal products
Time zone and current time in Botswana
Go to our interactive map to get the current time in Botswana