Qatar

| Government | |
| Name | State of Qatar |
| Arabic | دولة قطر Dawlat Qaṭar |
| Government type | absolute monarchy |
| Capital | Doha (2,382,000 (2018)) |
| Currency | Riyal (QAR) |
| People | |
| Population (2020) | 2,881,060 (139th) |
| Density of population | 176 P/km2 (76th) |
| Nationality | Qatari |
| Official languages | |
| Arabic | |
| Ethnic groups (2015) | |
| non-Qatari | 88.4% |
| Qatari | 11.6% |
| Ethnic groups (2010) | |
| Muslim | 67.7% |
| Christian | 13.8% |
| Hindu | 13.8% |
| Buddhist | 3.1% |
| folk religion | <0.1% |
| Jewish | <0.1% |
| Other | 0.7% |
| unaffiliated | 0.9% |
| Life expectancy (2020) | |
| Male | 77.2 years |
| Female | 81.6 years |
| Total population | 79.4 years (54th) |
| Homicides | |
| Total (2014) | 0.4 per 100,000 people (168th) |
| Geography | |
| Land area | 11,586 km2 |
| water area | 0 km2 |
| total area | 11,586 km2 (165th) |
| Mean elevation | 28 m |
| Lowest point | |
| Persian Gulf | 0 m |
| Highest point | |
| Tuwayyir al Hamir | 103 m |
| Land use (2011) | |
| Agricultural land | 5.6% |
| Arable land | 1.1% |
| Permanent crops | 0.2% |
| Permanent pasture | 4.3% |
| Forest | 0% |
| Other | 94.4% |
| Urbanization | |
| Urban population (2020) | 99.2% |
| Rate of urbanization | 2.41% annual rate of change (2015 – 2020) |
| Economy | |
| Labor force (2017) | 1.953 million (126th) |
| Labor force by occupation | |
| Agriculture | NA |
| Industry | NA |
| Services | NA |
| Unemployment rate (2017) | 8.9% (128th) |
| GDP (PPP) (estimate 2020) | |
| Total | $357.338 billion (51st) |
| Per capita | $138,910 (1st) |
| GDP (nominal) (estimate 2018) | |
| Total | $183.807 billion (56th) |
| Per capita | $66,202 (6th) |
| GDP by sector (estimate 2017) | |
| Agriculture | 0.2% |
| Industry | 50.3% |
| Services | 49.5% |
| Exports (2017) | $67.5 billion (44th) |
| Exports partners (2017) | |
| Japan | 17.3% |
| South Korea | 16% |
| India | 12.6% |
| China | 11.2% |
| Singapore | 8.2% |
| UAE | 6.4% |
| Imports (2017) | $30.77 billion (67th) |
| Imports partners (2017) | |
| China | 10.9% |
| US | 8.9% |
| UAE | 8.5% |
| Germany | 8.1% |
| UK | 5.5% |
| India | 5.4% |
| Japan | 5.3% |
| Italy | 4.3% |
Qatar on the world map
Qatar is located in Asia and more specifically in the Middle East.
Demography
Population pyramid
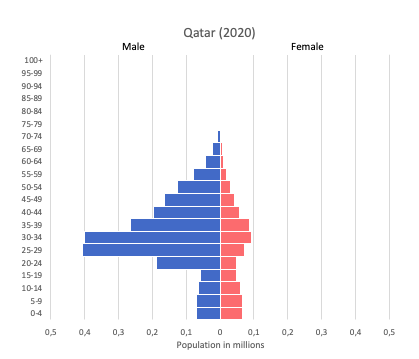
Age structure data
Estimate for 2020:
- 0-14 years: 12.84% (male 158,702/female 155,211)
- 15-24 years: 11.78% (male 203,703/female 84,323)
- 25-54 years: 70.66% (male 1,439,364/female 287,575)
- 55-64 years: 3.53% (male 66,561/female 19,600)
- 65 years and over: 1.19% (male 19,067/female 10,068)
Remark: the age structure of a population affects a nation’s key socioeconomic issues. Countries with young populations (high percentage under age 15) need to invest more in schools, while countries with older populations (high percentage ages 65 and over) need to invest more in the health sector. The age structure can also be used to help predict potential political issues. For example, the rapid growth of a young adult population unable to find employment can lead to unrest.
Population from 1950 to 2020
Source: United Nations, Department of Economic and Social Affairs, Population Division (2019). World Population Prospects 2019, Online Edition. Rev. 1.
Evolution of the life expectancy from 1960 to 2018
Source: World Development Indicators, The World Bank
Economy
Agriculture:
fruits, vegetables, poultry, dairy products, beef, fish
Industries:
liquefied natural gas, crude oil production and refining, ammonia, fertilizer, petrochemicals, steel reinforcing bars, cement, commercial ship repair
Exports – commodities:
liquefied natural gas (LNG), petroleum products, fertilizers, steel
Imports – commodities:
machinery and transport equipment, food, chemicals
Time zone and current time in Qatar
Go to our interactive map to get the current time in Qatar