Samoa
| Government | |
| Name | Independent State of Samoa |
| Samoan | Malo Saʻoloto Tutoʻatasi o Sāmoa |
| Government type | parliamentary republic |
| Capital | Apia 37,391 (2016)) |
| Currency | tālā (WST) |
| Organization | |
| Member State | Commonwealth of Nations |
| People | |
| Population (2020) | 198,410 (187th) |
| Density of population | 68 P/km2 |
| Nationality | Samoan |
| Official languages | |
| Samoan | |
| English | |
| Ethnic groups (2011) | |
| Samoan | 96% |
| Other | 4% |
| Religions (2016) | |
| Protestant | 54.9% |
| Congregationalist | 29% |
| Methodist | 12.4% |
| Assembly of God | 6.8% |
| Seventh Day Adventist | 4.4% |
| other Protestant | 2.3% |
| Roman Catholic | 18.8% |
| Mormon | 16.9% |
| Worship Centre | 2.8% |
| other Christian | 3.6% |
| other | 2.9% |
| none | 0.2% |
| Life expectancy (2020) | |
| Male | 71.7 years |
| Female | 77.7 years |
| Total population | 74.7 years (128th) |
| Homicides | |
| Total (2013) | 3.1 per 100,000 people (81st) |
| Geography | |
| Land area | 2,821 km2 |
| water area | 10 km2 |
| total area | 2,831 km2 (178th) |
| Lowest point | |
| Pacific Ocean | 0 m |
| Highest point | |
| Mount Silisili | 1,857 m |
| Land use (2011) | |
| Agricultural land | 12.4% |
| Arable land | 2.8% |
| Permanent crops | 7.8% |
| Permanent pasture | 1.8% |
| Forest | 60.4% |
| Other | 27.2% |
| Urbanization | |
| Urban population (2020) | 17.9% |
| Rate of urbanization | -0.47% annual rate of change (2015 – 2020) |
| Economy | |
| Labor force (2016) | 50,700 (192nd) |
| Labor force by occupation (2015) | |
| Agriculture | 65% |
| Industry | 6% |
| Services | 29% |
| Unemployment rate (2017) | 5.2% (78th) |
| GDP (PPP) (estimate 2018) | |
| Total | $1.188 billion |
| Per capita | $5,962 |
| GDP (nominal) (estimate 2018) | |
| Total | $881 million |
| Per capita | $4,420 |
| GDP by sector (estimate 2017) | |
| Agriculture | 10.4% |
| Industry | 23.6% |
| Services | 66% |
| Exports (2014) | $27.5 million (207th) |
| Exports partners (2017) | |
| Australia | 22.9% |
| NZ | 22.8% |
| American Samoa | 22.1% |
| Afghanistan | 14.9% |
| US | 5.9% |
| Imports (2018) | $89.29 billion (41st) |
| Imports partners (2017) | |
| NZ | 22% |
| Singapore | 20.7% |
| US | 12.5% |
| China | 10.1% |
| Australia | 8.6% |
| Fiji | 5.2% |
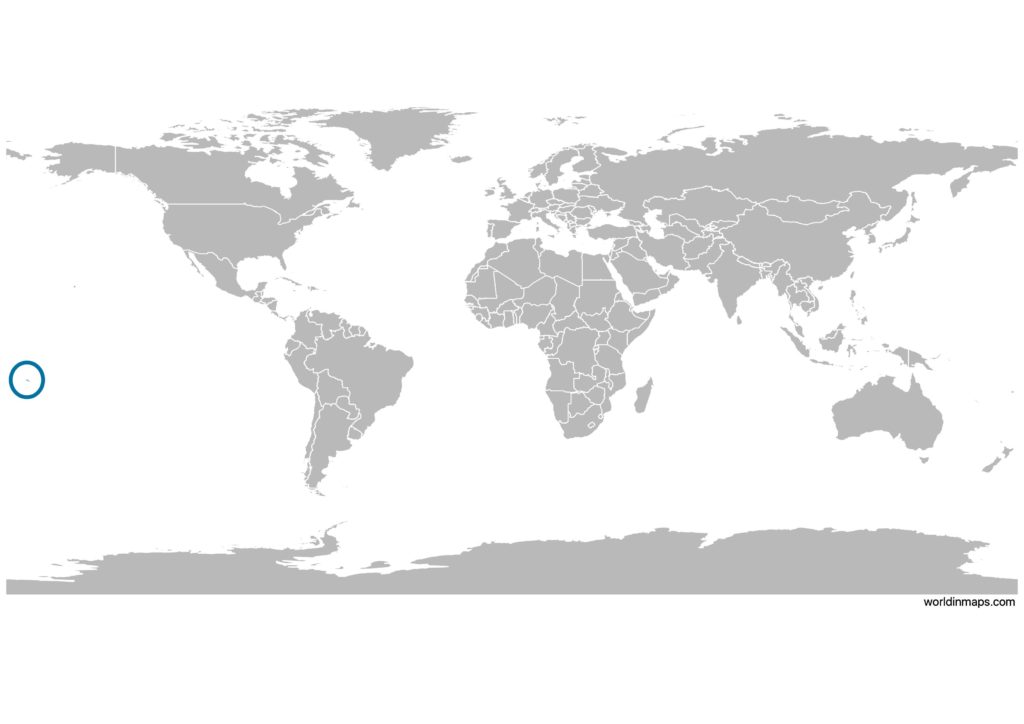
Samoa on the world map
Demography
Population pyramid
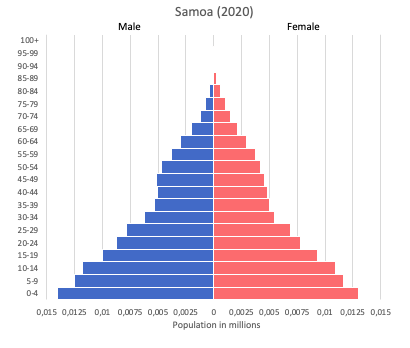
Age structure data
Estimate for 2020:
- 0-14 years: 29.31% (male 30,825/female 28,900)
- 15-24 years: 19.61% (male 20,519/female 19,439)
- 25-54 years: 37.4% (male 39,011/female 37,200)
- 55-64 years: 7.5% (male 7,780/female 7,505)
- 65 years and over: 6.18% (male 5,513/female 7,082)
Remark: the age structure of a population affects a nation’s key socioeconomic issues. Countries with young populations (high percentage under age 15) need to invest more in schools, while countries with older populations (high percentage ages 65 and over) need to invest more in the health sector. The age structure can also be used to help predict potential political issues. For example, the rapid growth of a young adult population unable to find employment can lead to unrest.
Population from 1950 to 2020
Source: United Nations, Department of Economic and Social Affairs, Population Division (2019). World Population Prospects 2019, Online Edition. Rev. 1.
Evolution of the life expectancy from 1960 to 2018
Source: World Development Indicators, The World Bank
Economy
Agriculture:
coconuts, nonu, bananas, taro, yams, coffee, cocoa
Industries:
food processing, building materials, auto parts
Exports – commodities:
fish, coconut oil and cream, nonu, copra, taro, automotive parts, garments, beer
Imports – commodities:
machinery and equipment, industrial supplies, foodstuffs
Time zone and current time in Samoa
Go to our interactive map to get the current time in Samoa