Fiji
| Government | |
| Name | Republic of Fiji |
| Fijian | Matanitu Tugalala o Viti |
| Fiji Hindi | फ़िजी गणराज्य Fijī Gaṇarājya |
| Government type | Parliamentary republic |
| Capital | Suva (93,970 (2017)) |
| Currency | Fijian dollar (FJD) |
| Organization | |
| Member State | Commonwealth of Nations |
| People | |
| Population (2020) | 896,444 (161st) |
| Density of population | 46.4 P/km2 (148st) |
| Nationality | Fijian |
| Official languages | |
| English | |
| Fijian | |
| Fiji Hindi | |
| Ethnic groups (2007) | |
| iTaukei (original and native settlers of Fiji) | 56.8% |
| Indo-Fijian | 37.5% |
| Rotuman | 1.2% |
| Other | 4.5% |
| Religions (2007) | |
| Protestant | 45% |
| Methodist | 34.6% |
| Assembly of God | 5.7% |
| Seventh Day Adventist | 3.9% |
| Anglican | 0.8% |
| Hindu | 27.9% |
| Other Christian | 10.4% |
| Roman Catholic | 9.1% |
| Muslim | 6.3% |
| Sikh | 0.3% |
| Other | 0.3% |
| None | 0.8% |
| Life expectancy (2020) | |
| Male | 71 years |
| Female | 76.6 years |
| Total population | 73.7 years (141st) |
| Homicides | |
| Total (2014) | 2.3 per 100,000 people (97th) |
| Geography | |
| Land area | 18,274 km2 |
| water area | 0 km2 |
| total area | 18,274 km2 (157th) |
| Lowest point | |
| Pacific Ocean | 0 m |
| Highest point | |
| Tomanivi | 1,324 m |
| Land use (2011) | |
| Agricultural land | 23.3% |
| Arable land | 9% |
| Permanent crops | 4.7% |
| Permanent pasture | 9.6% |
| Forest | 55.7% |
| Other | 21% |
| Urbanization | |
| Urban population (2020) | 57.2% |
| Rate of urbanization | 1.62% annual rate of change (2015 – 2020) |
| Economy | |
| Labor force (2017) | 353,100 (161st) |
| Labor force by occupation (2013) | |
| Agriculture | 44.2% |
| Industry | 14.3% |
| Services | 41.6% |
| Unemployment rate (2017) | 4.5% (63rd) |
| GDP (PPP) (estimate 2018) | |
| Total | $9.112 billion |
| Per capita | $10,251 |
| GDP (nominal) (estimate 2018) | |
| Total | $5.223 billion |
| Per capita | $5,876 |
| GDP by sector (estimate 2017) | |
| Agriculture | 13.5% |
| Industry | 17.4% |
| Services | 69.1% |
| Exports (2017) | $908.2 million (163rd) |
| Exports partners (2017) | |
| US | 20.8% |
| Australia | 14.9% |
| NZ | 7.7% |
| Tonga | 5% |
| Vanuatu | 4.6% |
| China | 4.5% |
| Spain | 4.3% |
| UK | 4.3% |
| Kiribati | 4.1% |
| Imports (2017) | $1.911 billion (169th) |
| Imports partners (2017) | |
| Australia | 19.2% |
| NZ | 17.2% |
| Singapore | 17% |
| China | 13.8% |
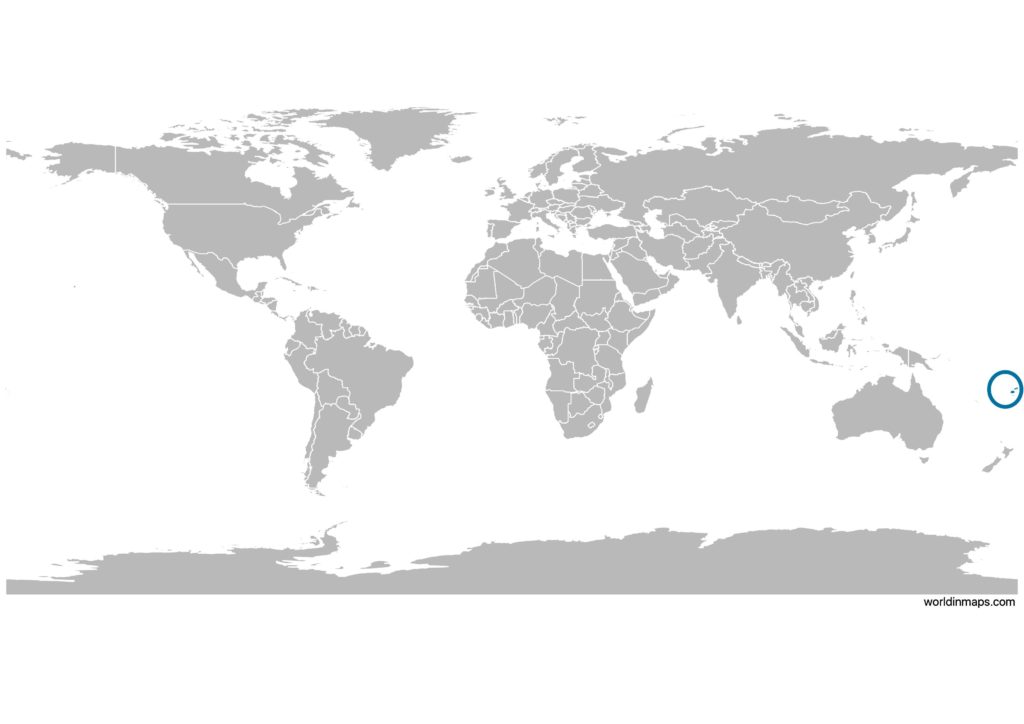
Fiji on the world map
Demography
Population pyramid
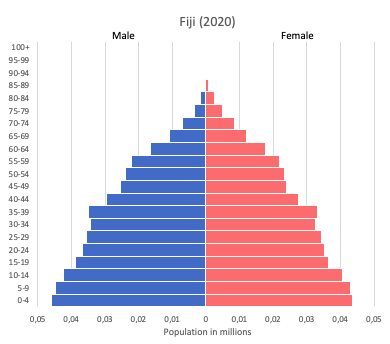
Age structure data
Estimate for 2020:
- 0-14 years: 26.86% (male 128,499/female 122,873)
- 15-24 years: 15.51% (male 73,993/female 71,139)
- 25-54 years: 41.05% (male 196,932/female 187,270)
- 55-64 years: 9.25% (male 43,813/female 42,763)
- 65 years and over: 7.34% (male 31,556/female 37,136)
Remark: the age structure of a population affects a nation’s key socioeconomic issues. Countries with young populations (high percentage under age 15) need to invest more in schools, while countries with older populations (high percentage ages 65 and over) need to invest more in the health sector. The age structure can also be used to help predict potential political issues. For example, the rapid growth of a young adult population unable to find employment can lead to unrest.
Population from 1950 to 2020
Source: United Nations, Department of Economic and Social Affairs, Population Division (2019). World Population Prospects 2019, Online Edition. Rev. 1.
Evolution of the life expectancy from 1960 to 2018
Source: World Development Indicators, The World Bank
Economy
Agriculture:
sugarcane, copra, ginger, tropical fruits, vegetables; beef, pork, chicken, fish
Industries:
tourism, sugar processing, clothing, copra, gold, silver, lumber
Exports – commodities:
fuel, including oil, fish, beverages, gems, sugar, garments, gold, timber, fish, molasses, coconut oil, mineral water
Imports – commodities:
manufactured goods, machinery and transport equipment, petroleum products, food and beverages, chemicals, tobacco
Time zone and current time in Fiji
Go to our interactive map to get the current time in Fiji