Tonga
| Government | |
| Name | Kingdom of Tonga |
| Tongan | Puleʻanga Fakatuʻi ʻo Tonga |
| Government type | constitutional monarchy |
| Capital | Nuku’alofa (23,221 (2016)) |
| Currency | Paʻanga (TOP) |
| Organization | |
| Member State | Commonwealth of Nations |
| People | |
| Population (2020) | 105,697 (199th) |
| Density of population | 139 P/km2 (76th) |
| Nationality | Tongan |
| Official languages | |
| Tongan | |
| English | |
| Ethnic groups (2016) | |
| Tongan | 97% |
| part-Tongan | 0.8% |
| other | 2.2% |
| Religions (2016) | |
| Protestant | 64.1% |
| Free Wesleyan Church | 35% |
| Free Church of Tonga | 11.9% |
| Church of Tonga | 6.8% |
| Assembly of God | 2.3% |
| Seventh Day Adventist | 2.2% |
| Tokaikolo Christian Church | 1.6% |
| other | 4.3% |
| Mormon | 18.6% |
| Roman Catholic | 14.2% |
| other | 2.4% |
| none | 0.5% |
| unspecified | 0.1% |
| Life expectancy (2020) | |
| Male | 75.4 years |
| Female | 78.8 years |
| Total population | 77 years (87th) |
| Homicides | |
| Total (2012) | 1.0 per 100,000 people (141st) |
| Geography | |
| Land area | 717 km2 |
| water area | 30 km2 |
| total area | 747 km2 (190th) |
| Lowest point | |
| Pacific Ocean | 0 m |
| Highest point | |
| Kao Volcano on Kao Island | 1,046 m |
| Land use (2011) | |
| Agricultural land | 43.1% |
| Arable land | 22.2% |
| Permanent crops | 15.3% |
| Permanent pasture | 5.6% |
| Forest | 12.5% |
| Other | 44.4% |
| Urbanization | |
| Urban population (2020) | 23.1% |
| Rate of urbanization | 0.71% annual rate of change (2015 – 2020) |
| Economy | |
| Labor force (2011) | 33,800 (201st) |
| Labor force by occupation | |
| Agriculture | NA |
| Industry | NA |
| Services | NA |
| Unemployment rate (2011) | 1.1% (12th) |
| GDP (PPP) (estimate 2019) | |
| Total | $655 million |
| Per capita | $6,496 |
| GDP (nominal) (estimate 2019) | |
| Total | $493 million |
| Per capita | $4,888 |
| GDP by sector (estimate 2017) | |
| Agriculture | 19.9% |
| Industry | 20.3% |
| Services | 59.8% |
| Exports (2017) | $18.4 million (213th) |
| Exports partners (2017) | |
| Hong Kong | 25.1% |
| NZ | 22.6% |
| US | 14.3% |
| Japan | 12.8% |
| Australia | 10.5% |
| Imports (2017) | $250.2 million (208th) |
| Imports partners (2017) | |
| NZ | 33.3% |
| Fiji | 11.7% |
| US | 9.8% |
| Singapore | 9% |
| Australia | 8.9% |
| China | 7.9% |
| Japan | 5.9% |
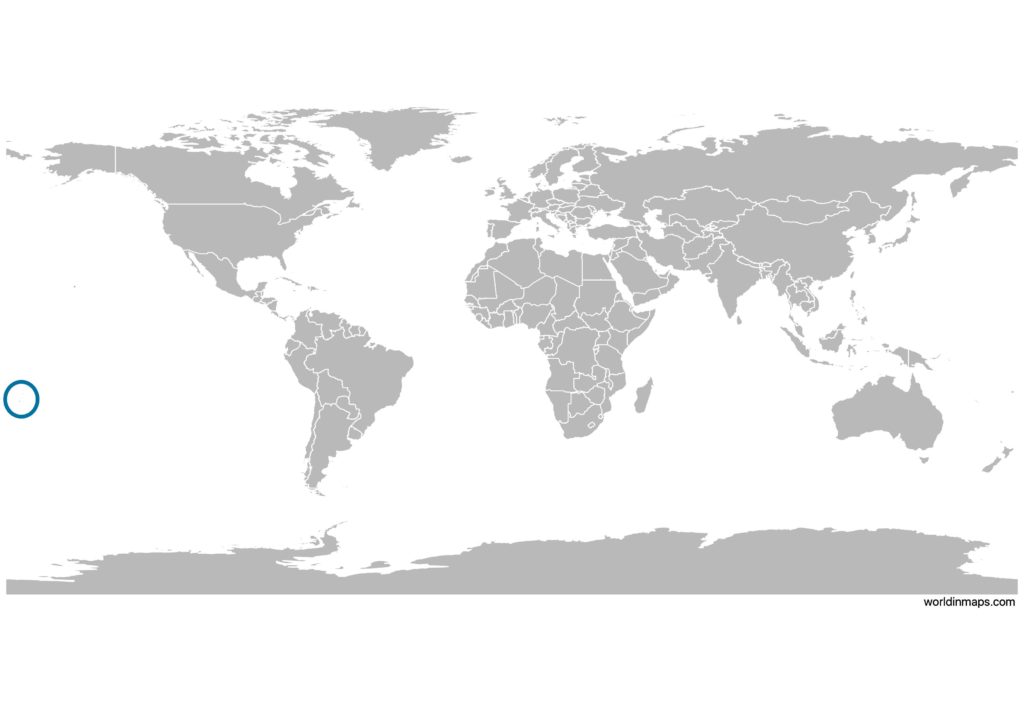
Tonga on the world map
Demography
Population pyramid
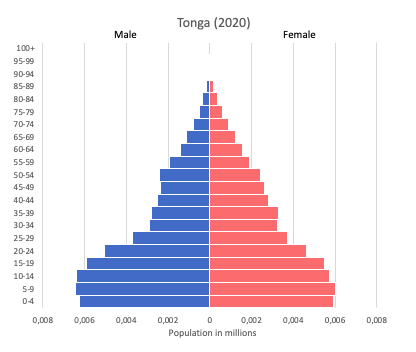
Age structure data
Estimate for 2020:
- 0-14 years: 32% (male 17,250/female 16,698)
- 15-24 years: 19.66% (male 10,679/female 10,175)
- 25-54 years: 35.35% (male 18,701/female 18,802)
- 55-64 years: 6.17% (male 3,345/female 3,202)
- 65 years and over: 6.83% (male 3,249/female 3,994)
Remark: the age structure of a population affects a nation’s key socioeconomic issues. Countries with young populations (high percentage under age 15) need to invest more in schools, while countries with older populations (high percentage ages 65 and over) need to invest more in the health sector. The age structure can also be used to help predict potential political issues. For example, the rapid growth of a young adult population unable to find employment can lead to unrest.
Population from 1950 to 2020
Source: United Nations, Department of Economic and Social Affairs, Population Division (2019). World Population Prospects 2019, Online Edition. Rev. 1.
Evolution of the life expectancy from 1960 to 2018
Source: World Development Indicators, The World Bank
Economy
Agriculture:
squash, coconuts, copra, bananas, vanilla beans, cocoa, coffee, sweet potatoes, cassava, taro, and kava
Industries:
tourism, construction, fishing
Exports – commodities:
squash, fish, vanilla beans, root crops, kava
Imports – commodities:
foodstuffs, machinery and transport equipment, fuels, chemicals
Time zone and current time in Tonga
Go to our interactive map to get the current time in Tonga