Vanuatu
| Government | |
| Name | Republic of Vanuatu |
| Bislama | Ripablik blong Vanuatu |
| French | République de Vanuatu |
| Government type | parliamentary republic |
| Capital | Port-Vila (51,437 (2016)) |
| Currency | Vanuatu vatu (VUV) |
| Organization | |
| Member State | Commonwealth of Nations |
| People | |
| Population (2020) | 307,150 (181st) |
| Density of population | 19.7 P/km2 (188th) |
| Nationality | Ni-Vanuatu |
| Official languages | |
| Bislama | |
| French | |
| English | |
| Ethnic groups (2016) | |
| Melanesian | 99.2% |
| non-Melanesian | 0.8% |
| Religions (2009) | |
| Protestant | 70% |
| Presbyterian | 27.9% |
| Anglican | 15.1% |
| Seventh Day Adventist | 12.5% |
| Assemblies of God | 4.7% |
| Church of Christ | 4.5% |
| Neil Thomas Ministry | 3.1% |
| Apostolic | 2.2% |
| Roman Catholic | 12.4% |
| customary beliefs | 3.7% |
| other | 12.6% |
| none | 1.1% |
| unspecified | 0.2% |
| Life expectancy (2020) | |
| Male | 72.9 years |
| Female | 76.4 years |
| Total population | 74.6 years (130th) |
| Homicides | |
| n.a. | |
| Geography | |
| Land area | 12,189 km2 |
| water area | 0 km2 |
| total area | 12,189 km2 (163rd) |
| Lowest point | |
| Pacific Ocean | 0 m |
| Highest point | |
| Tabwemasana | 1,877 m |
| Land use (2011) | |
| Agricultural land | 15.3% |
| Arable land | 1.6% |
| Permanent crops | 10.3% |
| Permanent pasture | 3.4% |
| Forest | 36.1% |
| Other | 48.6% |
| Urbanization | |
| Urban population (2020) | 25.5% |
| Rate of urbanization | 2.55% annual rate of change (2015 – 2020) |
| Economy | |
| Labor force (2007) | 115,900 (182nd) |
| Labor force by occupation (2000) | |
| Agriculture | 65% |
| Industry | 5% |
| Services | 30% |
| Unemployment rate (1999) | 1.7% (16th) |
| GDP (PPP) (estimate 2018) | |
| Total | $820 million (178th) |
| Per capita | $2,850 (155th) |
| GDP (nominal) (estimate 2018) | |
| Total | $957 million (175th) |
| Per capita | $3,327 (124th) |
| GDP by sector (estimate 2017) | |
| Agriculture | 27.3% |
| Industry | 11.8% |
| Services | 60.8% |
| Exports (2017) | $44.7 million (204th) |
| Exports partners (2017) | |
| Philippines | 23.9% |
| Australia | 16.5% |
| US | 10.4% |
| Japan | 8.8% |
| Venezuela | 8% |
| France | 4.8% |
| Fiji | 4.5% |
| Hong Kong | 4.4% |
| Imports (2017) | $273.7 million (207th) |
| Imports partners (2017) | |
| Russia | 35.2% |
| Australia | 19.8% |
| NZ | 9.8% |
| China | 6.3% |
| Fiji | 5.5% |
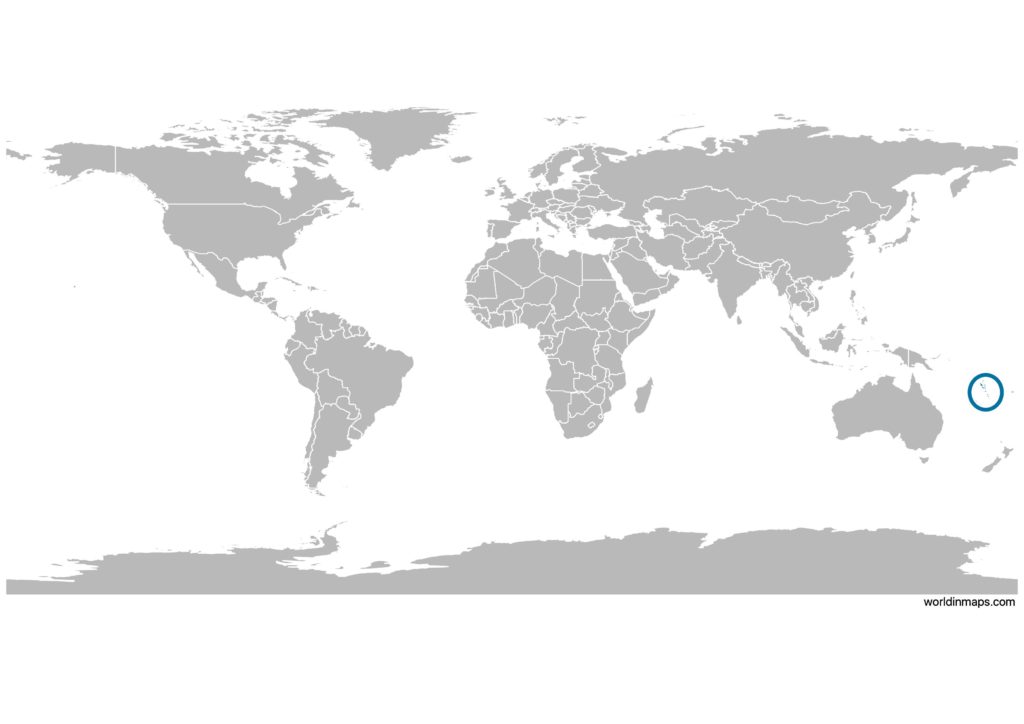
Vanuatu on the world map
Demography
Population pyramid
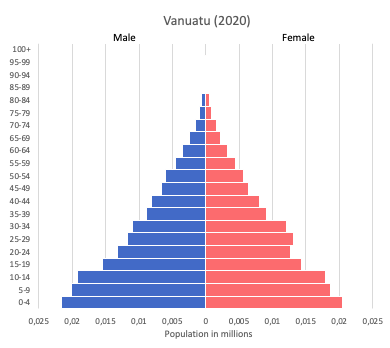
Age structure data
Estimate for 2020:
- 0-14 years: 33.65% (male 51,267/female 49,111)
- 15-24 years: 19.99% (male 29,594/female 30,050)
- 25-54 years: 36.09% (male 52,529/female 55,130)
- 55-64 years: 5.89% (male 8,666/female 8,904)
- 65 years and over: 4.39% (male 6,518/female 6,564)
Remark: the age structure of a population affects a nation’s key socioeconomic issues. Countries with young populations (high percentage under age 15) need to invest more in schools, while countries with older populations (high percentage ages 65 and over) need to invest more in the health sector. The age structure can also be used to help predict potential political issues. For example, the rapid growth of a young adult population unable to find employment can lead to unrest.
Population from 1950 to 2020
Source: United Nations, Department of Economic and Social Affairs, Population Division (2019). World Population Prospects 2019, Online Edition. Rev. 1.
Evolution of the life expectancy from 1960 to 2018
Source: World Development Indicators, The World Bank
Economy
Agriculture:
copra, coconuts, cocoa, coffee, taro, yams, fruits, vegetables, beef, fish
Industries:
food and fish freezing, wood processing, meat canning
Exports – commodities:
copra, beef (veal), cocoa, timber, kava, coffee, coconut oil, shell, cowhides, coconut meal, fish
Imports – commodities:
machinery and equipment, foodstuffs, fuels
Time zone and current time in Vanuatu
Go to our interactive map to get the current time in Vanuatu