Ecuador
| Government | |
| Name | Republic of Ecuador |
| Spanish | República del Ecuador |
| Cañar Highland Quichua | Ikwayur Runaq Imayka |
| Shuar | Ekuatur Nunka |
| Government type | Presidential republic |
| Capital | Quito (2,781,641 (2020)) |
| Currency | United States dollar (USD) |
| People | |
| Population (2020) | 17,643,060 (67th) |
| Density of population | 61 P/km2 (151st) |
| Nationality | Ecuadorian |
| Official languages | |
| Spanish | |
| Recognized regional languages | |
| Kichwa (Quichua) | |
| Shuar | |
| Ethnic groups (2010) | |
| Mestizo (mixed Amerindian and white) | 71.9% |
| Montubio | 7.4% |
| Amerindian | 7% |
| White | 6.1% |
| Afroecuadorian | 4.3% |
| Mulatto | 1.9% |
| Black | 1% |
| 0ther | 0.4% |
| Religions (2012) | |
| Roman Catholic | 74% |
| Evangelical | 10.4% |
| Jehovah’s Witness | 1.2% |
| Other | 6.4% |
| Atheist | 7.9% |
| Agnostic | 0.1% |
| note: data from persons at least 16 years of age from five Ecuadoran cities | |
| Life expectancy (2020) | |
| Male | 74.5 years |
| Female | 80.6 years |
| Total population | 77.5 years (80th) |
| Homicides | |
| Total (2018) | 5.8 per 100,000 people (56th) |
| Geography | |
| Land area | 276,841 km2 |
| water area | 6,720 km2 |
| total area | 283,561 km2 (75th) |
| Mean elevation | 1,117 m |
| Lowest point | |
| Pacific Ocean | 0 m |
| Highest point | |
| Chimborazo | 6,267 m |
| Land use (2011) | |
| Agricultural land | 29.7% |
| Arable land | 4.7% |
| Permanent crops | 5.6% |
| Permanent pasture | 19.4% |
| Forest | 38.9% |
| Other | 31.4% |
| Urbanization | |
| Urban population (2020) | 64.2% |
| Rate of urbanization | 1.66% annual rate of change (2015 – 2020) |
| Economy | |
| Labor force (2017) | 8.086 million (62nd) |
| Labor force by occupation (2017) | |
| Agriculture | 26.1% |
| Industry | 18.4% |
| Services | 55.5% |
| Unemployment rate (2017) | 4.6% (66th) |
| GDP (PPP) (estimate 2019) | |
| Total | $202.043 billion |
| Per capita | $11,701 |
| GDP (nominal) (estimate 2019) | |
| Total | $106.289 billion |
| Per capita | $6,155 |
| GDP by sector (estimate 2017) | |
| Agriculture | 6.7% |
| Industry | 32.9% |
| Services | 60.4% |
| Exports (2017) | $19.62 billion (70th) |
| Exports partners (2017) | |
| US | 31.5% |
| Vietnam | 7.6% |
| Peru | 6.7% |
| Chile | 6.5% |
| Panama | 4.9% |
| Russia | 4.4% |
| China | 4% |
| Imports (2017) | $19.31 billion (78th) |
| Imports partners (2017) | |
| US | 22.8% |
| China | 15.4% |
| Colombia | 8.7% |
| Panama | 6.4% |
| Brazil | 4.4% |
| Peru | 4.2% |
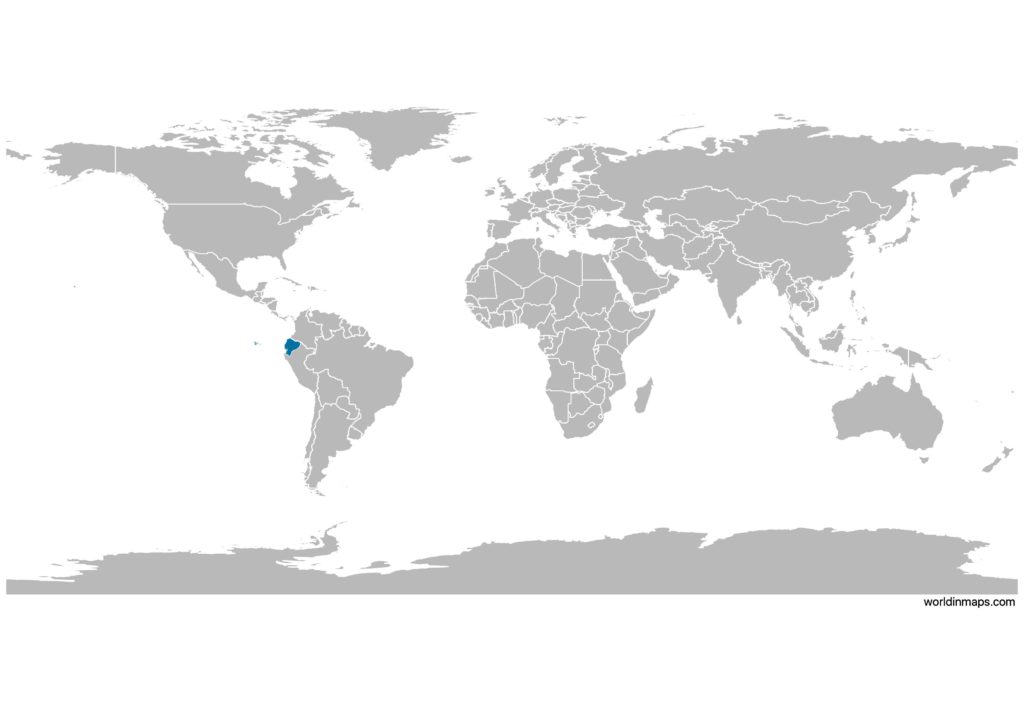
Ecuador on the world map
Ecuador top 10 largest cities (2020)
- Quito (2,781,641)
- Guayaquil (2,723,665)
- Cuenca (636,996)
- Santo Domingo (458,580)
- Ambato (387,309)
- Portoviejo (321,800)
- Durán (315,724)
- Machala (289,141)
- Loja (274,112)
- Manta (264,281)
Demography
Population pyramid
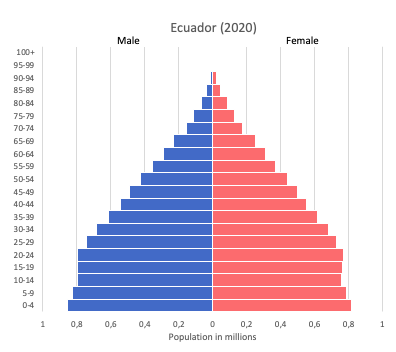
Age structure data
Estimate for 2020:
- 0-14 years: 25.82% (male 2,226,240/female 2,138,219)
- 15-24 years: 17.8% (male 1,531,545/female 1,478,222)
- 25-54 years: 40.31% (male 3,333,650/female 3,480,262)
- 55-64 years: 7.92% (male 647,718/female 691,759)
- 65 years and over: 8.15% (male 648,761/female 728,491)
Remark: the age structure of a population affects a nation’s key socioeconomic issues. Countries with young populations (high percentage under age 15) need to invest more in schools, while countries with older populations (high percentage ages 65 and over) need to invest more in the health sector. The age structure can also be used to help predict potential political issues. For example, the rapid growth of a young adult population unable to find employment can lead to unrest.
Population from 1950 to 2020
Source: United Nations, Department of Economic and Social Affairs, Population Division (2019). World Population Prospects 2019, Online Edition. Rev. 1.
Evolution of the life expectancy from 1960 to 2018
Source: World Development Indicators, The World Bank
Economy
Agriculture:
bananas, coffee, cocoa, rice, potatoes, cassava (manioc, tapioca), plantains, sugarcane, cattle, sheep, pigs, beef, pork, dairy products, fish, shrimp, balsa wood
Industries:
petroleum, food processing, textiles, wood products, chemicals
Exports – commodities:
petroleum, bananas, cut flowers, shrimp, cacao, coffee, wood, fish
Imports – commodities:
industrial materials, fuels and lubricants, nondurable consumer goods
Time zone and current time in Ecuador
Go to our interactive map to get the current time in Ecuador