Myanmar (or Burma)

| Government | |
| Name | Republic of the Union of Myanmar |
| Burmese | ပြည်ထောင်စု သမ္မတ မြန်မာနိုင်ငံတော် Pyidaunzu Thanmăda Myăma Nainngandaw |
| Government type | Unitary parliamentary constitutional republic |
| Capital | Naypyidaw (1,160,242) |
| Currency | Kyat (MMK) |
| Organization | |
| Observer State | South Asian Association for Regional Cooperation (SAARC) |
| People | |
| Population (2020) | 54,409,794 (26st) |
| Density of population | 76 P/km2 (125th) |
| Nationality | Burmese / Myanma |
| Official languages | |
| Burmese | |
| Ethnic groups | |
| Burman (Bamar) | 68% |
| Shan | 9% |
| Karen | 7% |
| Rakhine | 4% |
| Chinese | 3% |
| Indian | 2% |
| Mon | 2% |
| Other | 5% |
| Religions (2014) | |
| Buddhist | 87.9% |
| Christian | 6.2% |
| Muslim | 4.3% |
| Animist | 0.8% |
| Hindu | 0.5% |
| other | 0.2% |
| none | 0.1% |
| Life expectancy (2020) | |
| Male | 67.7 years |
| Female | 71.1 years |
| Total population | 69.3 years (169th) |
| Homicides | |
| Total (2016) | 2.3 per 100,000 people (100th) |
| Geography | |
| Land area | 653,508 km2 |
| water area | 23,070 km2 |
| total area | 676,578 km2 (41st) |
| Mean elevation | 702 m |
| Lowest point | |
| Andaman Sea / Bay of Bengal | 0 m |
| Highest point | |
| Gamlang Razi | 5,870 m |
| Land use (2011) | |
| Agricultural land | 19.2% |
| Arable land | 16.5% |
| Permanent crops | 2.2% |
| Permanent pasture | 0.5% |
| Forest | 48.2% |
| Other | 32.6% |
| Urbanization | |
| Urban population (2020) | 31.1% |
| Rate of urbanization | 1.74% annual rate of change (2015 – 2020) |
| Economy | |
| Labor force (2017) | 22.3 million (28th) |
| Labor force by occupation (2001) | |
| Agriculture | 70% |
| Industry | 7% |
| Services | 23% |
| Unemployment rate (2017) | 4% (50th) |
| GDP (PPP) (estimate 2019) | |
| Total | $355 billion (51st) |
| Per capita | $6,707 (128th) |
| GDP (nominal) (estimate 2019) | |
| Total | $66 billion (72nd) |
| Per capita | $1,245 (155th) |
| GDP by sector (estimate 2017) | |
| Agriculture | 24.1% |
| Industry | 35.6% |
| Services | 40.3% |
| Exports (2017) | $9.832 billion (93rd) |
| note: official export figures are grossly underestimated due to the value of timber, gems, narcotics, rice, and other products smuggled to Thailand, China, and Bangladesh | |
| Exports partners (2017) | |
| China | 36.5% |
| Thailand | 21.8% |
| Japan | 6.6% |
| Singapore | 6.4% |
| India | 5.9% |
| Imports (2017) | $15.78 billion (87th) |
| note: import figures are grossly underestimated due to the value of consumer goods, diesel fuel, and other products smuggled in from Thailand, China, Malaysia, and India | |
| Imports partners (2017) | |
| China | 31.4% |
| Singapore | 15% |
| Thailand | 11.1% |
| Saudi Arabia | 7.5% |
| Malaysia | 6.2% |
| Japan | 6% |
| India | 5.5% |
| Indonesia | 4.5% |
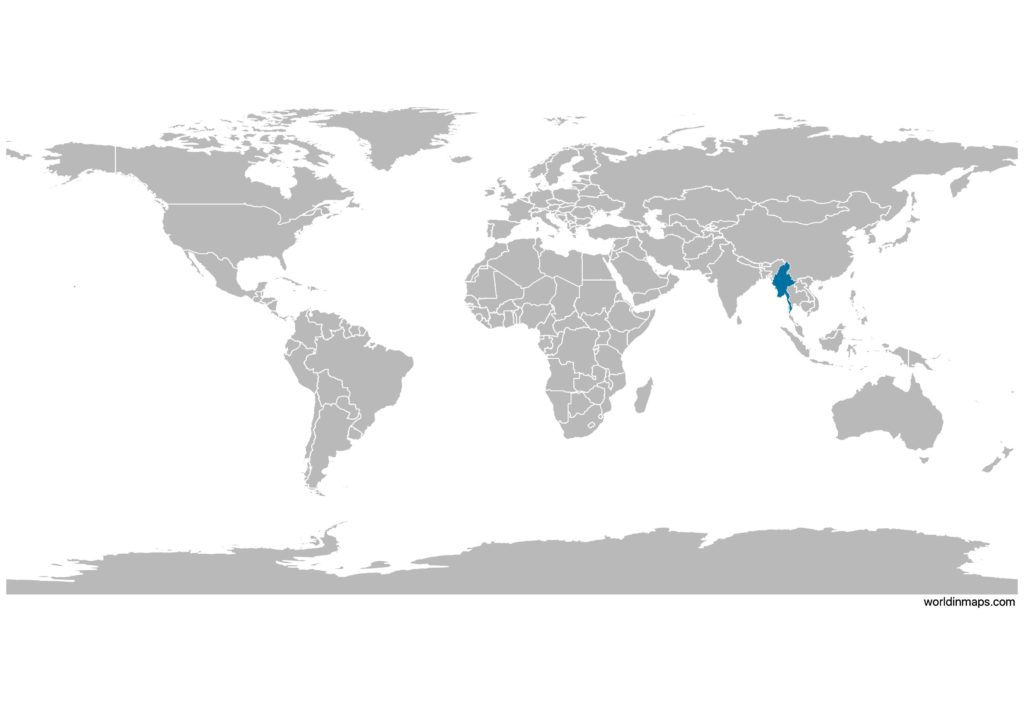
Myanmar on the world map
Myanmar (or Burma) top 10 largest cities
- Yangon (5,211,431)
- Mandalay (1,225,546)
- Naypyidaw (1,160,242)
- Bago (491,434)
- Hpa-an (421,575)
- Taunggyi (381,636)
- Monywa (372,095)
- Myitkyina (306,949)
- Mawlamyine (289,388)
- Magway (289,247)
Demography
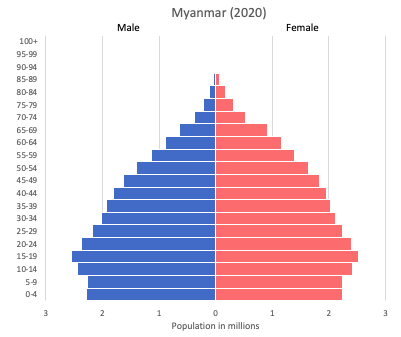
Population pyramid
Age structure data
Estimate for 2020:
- 0-14 years: 25.97% (male 7,524,869/female 7,173,333)
- 15-24 years: 17% (male 4,852,122/female 4,769,412)
- 25-54 years: 42.76% (male 11,861,971/female 12,337,482)
- 55-64 years: 8.22% (male 2,179,616/female 2,472,681)
- 65 years and over: 6.04% (male 1,489,807/female 1,928,778)
Remark: the age structure of a population affects a nation’s key socioeconomic issues. Countries with young populations (high percentage under age 15) need to invest more in schools, while countries with older populations (high percentage ages 65 and over) need to invest more in the health sector. The age structure can also be used to help predict potential political issues. For example, the rapid growth of a young adult population unable to find employment can lead to unrest.
Population from 1950 to 2020
Source: United Nations, Department of Economic and Social Affairs, Population Division (2019). World Population Prospects 2019, Online Edition. Rev. 1.
Evolution of the life expectancy from 1960 to 2018
Source: World Development Indicators, The World Bank
Economy
Agriculture:
rice, pulses, beans, sesame, groundnuts, sugarcane, fish and fish products, hardwood
Industries:
agricultural processing, wood and wood products, copper, tin, tungsten, iron, cement, construction materials, pharmaceuticals, fertilizer, oil and natural gas, garments, jade and gems
Exports – commodities:
natural gas, wood products, pulses and beans, fish, rice, clothing, minerals, including jade and gems
Imports – commodities:
fabric, petroleum products, fertilizer, plastics, machinery, transport equipment, cement, construction materials food products‘ edible oil
Time zone and current time in Myanmar (or Burma)
Go to our interactive map to get the current time in Myanmar (or Burma)