Gambia
| Government | |
| Name | Republic of The Gambia |
| Government type | Presidential republic |
| Capital | Banjul (34,589) |
| Currency | Dalasi (GMD) |
| Organization | |
| Member State | Commonwealth of Nations |
| People | |
| Population (2020) | 2,416,664 (144th) |
| Density of population | 176.1 P/km2 (74th) |
| Nationality | Gambian |
| Official languages | |
| English | |
| Ethnic groups (2013) | |
| Mandinka / Jahanka | 34% |
| Fulani / Tukulur / Lorobo | 22.4% |
| Wolof | 12.6% |
| Jola / Karoninka | 10.7% |
| Serahuleh | 6.6% |
| Serer | 3.2% |
| Manjago | 2.1% |
| Bambara | 1% |
| Creole / Aku Marabout | 0.7% |
| Other | 0.9% |
| Non-Gambian | 5.2% |
| No answer | 0.6% |
| Religions (2013) | |
| Muslim | 95.7% |
| Christian | 4.2% |
| None | 0.1% |
| No response | 0.1% |
| Life expectancy (2020) | |
| Male | 63.5 years |
| Female | 68.3 years |
| Total population | 65.8 years (190th) |
| Homicides | |
| n.a. | |
| Geography | |
| Land area | 10,120 km2 |
| water area | 1,180 km2 |
| total area | 11,300 km2 (166th) |
| Mean elevation | 34 m |
| Lowest point | |
| Atlantic Ocean | 0 m |
| Highest point | |
| Unnamed elevation | 53 m |
| Land use (2011) | |
| Agricultural land | 56.1% |
| Arable land | 41% |
| Permanent crops | 0.5% |
| Permanent pasture | 14.6% |
| Forest | 43.9% |
| Other | 0% |
| Urbanization | |
| Urban population (2020) | 62.6% |
| Rate of urbanization | 4.07% annual rate of change (2015 – 2020) |
| Economy | |
| Labor force (2007) | 777,100 (150th) |
| Labor force by occupation (1996) | |
| Agriculture | 75% |
| Industry | 19% |
| Services | 6% |
| Unemployment rate | NA |
| GDP (PPP) (estimate 2017) | |
| Total | $3.582 billion |
| Per capita | $1,686 |
| GDP (nominal) (estimate 2017) | |
| Total | $1.038 billion |
| Per capita | $488 |
| GDP by sector (estimate 2017) | |
| Agriculture | 20.4% |
| Industry | 14.2% |
| Services | 65.4% |
| Exports (2017) | $72.9 million (201st) |
| Exports partners (2017) | |
| Guinea-Bissau | 51.9% |
| Vietnam | 14.6% |
| Senegal | 8.8% |
| Mali | 7.2% |
| Imports (2017) | $376.9 million (201st) |
| Imports partners (2017) | |
| Cote d’Ivoire | 11.5% |
| Brazil | 10.6% |
| Spain | 10.2% |
| China | 7.8% |
| Russia | 6.4% |
| Netherlands | 5.3% |
| India | 5% |
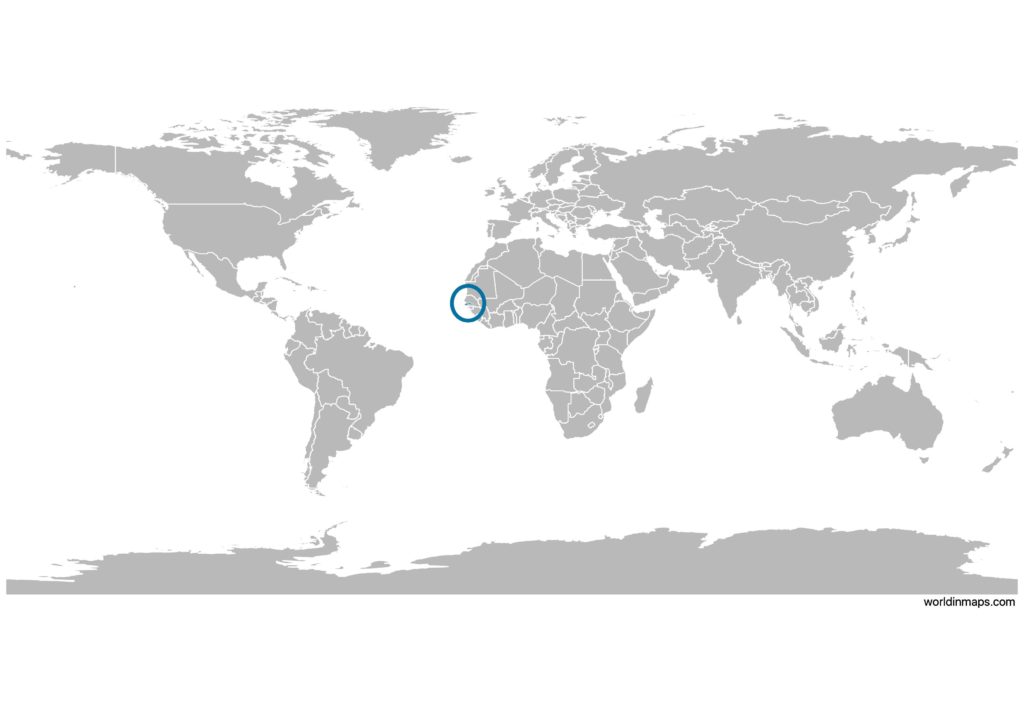
Gambia on the world map
Gambia top 10 largest cities
- Serekunda (340,000)
- Brikama (77,700)
- Bakau (43,098)
- Banjul (34,589)
- Farafenni (29,867)
- Lamin (24,797)
- Sukuta (15,131)
- Basse Santa Su (14,380)
- Gunjur (14,088)
- Soma (9,869)
Demography
Population pyramid
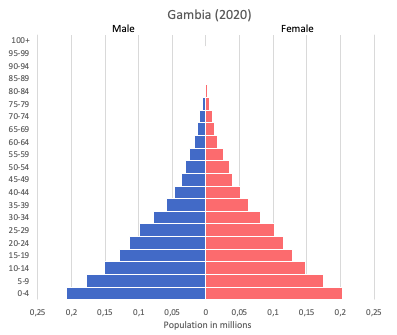
Age structure data
Estimate for 2020:
- 0-14 years: 35.96% (male 392,714/female 389,027)
- 15-24 years: 20.09% (male 216,307/female 220,514)
- 25-54 years: 35.85% (male 382,138/female 397,324)
- 55-64 years: 4.4% (male 45,614/female 50,143)
- 65 years and over: 3.69% (male 36,773/female 43,445)
Remark: the age structure of a population affects a nation’s key socioeconomic issues. Countries with young populations (high percentage under age 15) need to invest more in schools, while countries with older populations (high percentage ages 65 and over) need to invest more in the health sector. The age structure can also be used to help predict potential political issues. For example, the rapid growth of a young adult population unable to find employment can lead to unrest.
Population from 1950 to 2020
Source: United Nations, Department of Economic and Social Affairs, Population Division (2019). World Population Prospects 2019, Online Edition. Rev. 1.
Evolution of the life expectancy from 1960 to 2018
Source: World Development Indicators, The World Bank
Economy
Agriculture:
rice, millet, sorghum, peanuts, corn, sesame, cassava (manioc, tapioca), palm kernels; cattle, sheep, goats
Industries:
peanuts, fish, hides, tourism, beverages, agricultural machinery assembly, woodworking, metalworking, clothing
Exports – commodities:
peanut products, fish, cotton lint, palm kernels
Imports – commodities:
foodstuffs, manufactures, fuel, machinery and transport equipment
Time zone and current time in Gambia
Go to our interactive map to get the current time in Gambia