Sri Lanka
| Government | |
| Name | Democratic Socialist Republic of Sri Lanka |
| Sinhala | ශ්රී ලංකා ප්රජාතාන්ත්රික සමාජවාදී ජනරජය Srī Lankā Prajātāntrika Samājavādī Janarajaya |
| Tamil | இலங்கை சனநாயக சோசலிசக் குடியரசு Ilaṅkai Caṉanāyaka Cōcalicak Kuṭiyaracu |
| Government type | presidential republic |
| Capital (executive and judicial) | Colombo (561,314 (2012)) |
| Capital (legislative) | Sri Jayewardenepura Kotte (107,925 (2012)) |
| Currency | Sri Lankan rupee (LKR) |
| Organization | |
| Member State | South Asian Association for Regional Cooperation (SAARC) Commonwealth of Nations |
| People | |
| Population (2020) | 21,413,250 (58th) |
| Density of population | 327 P/km2 (43rd) |
| Nationality | Sri Lankan |
| Official languages | |
| Sinhala | |
| Tamil | |
| Ethnic groups (2012) | |
| Sinhalese | 74.9% |
| Sri Lankan Tamil | 11.2% |
| Sri Lankan Moors | 9.2% |
| Indian Tamil | 4.2% |
| Other | 0.5% |
| Religions (2012) | |
| Buddhist (official) | 70.2% |
| Hindu | 12.6% |
| Muslim | 9.7% |
| Roman Catholic | 6.1% |
| other Christian | 1.3% |
| other | 0.05% |
| Life expectancy (2020) | |
| Male | 74 years |
| Female | 81.1 years |
| Total population | 77.5 years (81st) |
| Homicides | |
| Total (2018) | 2.4 per 100,000 people (93rd) |
| Geography | |
| Land area | 64,630 km2 |
| water area | 980 km2 |
| total area | 65,610 km2 (123rd) |
| Mean elevation | 228 m |
| Lowest point | |
| Indian Ocean | 0 m |
| Highest point | |
| Pidurutalagala | 2,524 m |
| Land use (2011) | |
| Agricultural land | 43.5% |
| Arable land | 20.7% |
| Permanent crops | 15.8% |
| Permanent pasture | 7% |
| Forest | 29.4% |
| Other | 27.1% |
| Urbanization | |
| Urban population (2020) | 18.7% |
| Rate of urbanization | 0.85% annual rate of change (2015 – 2020) |
| Economy | |
| Labor force (2017) | 8.937 million (55th) |
| Labor force by occupation (2016) | |
| Agriculture | 27% |
| Industry | 26% |
| Services | 47% |
| Unemployment rate (2017) | 4.4% (59th) |
| GDP (PPP) (estimate 2020) | |
| Total | $321.856 billion (58th) |
| Per capita | $14,509 (91st) |
| GDP (nominal) (estimate 2020) | |
| Total | $92.111 billion (65th) |
| Per capita | $4,152 (109th) |
| GDP by sector (estimate 2017) | |
| Agriculture | 7.8% |
| Industry | 30.5% |
| Services | 61.7% |
| Exports (2017) | $11.36 billion (87th) |
| Exports partners (2017) | |
| US | 24.6% |
| UK | 9% |
| India | 5.8% |
| Singapore | 4.5% |
| Germany | 4.3% |
| Italy | 4.3% |
| Imports (2017) | $20.98 billion (73rd) |
| Imports partners (2017) | |
| India | 22% |
| China | 19.9% |
| Singapore | 6.9% |
| UAE | 5.7% |
| Japan | 4.9% |
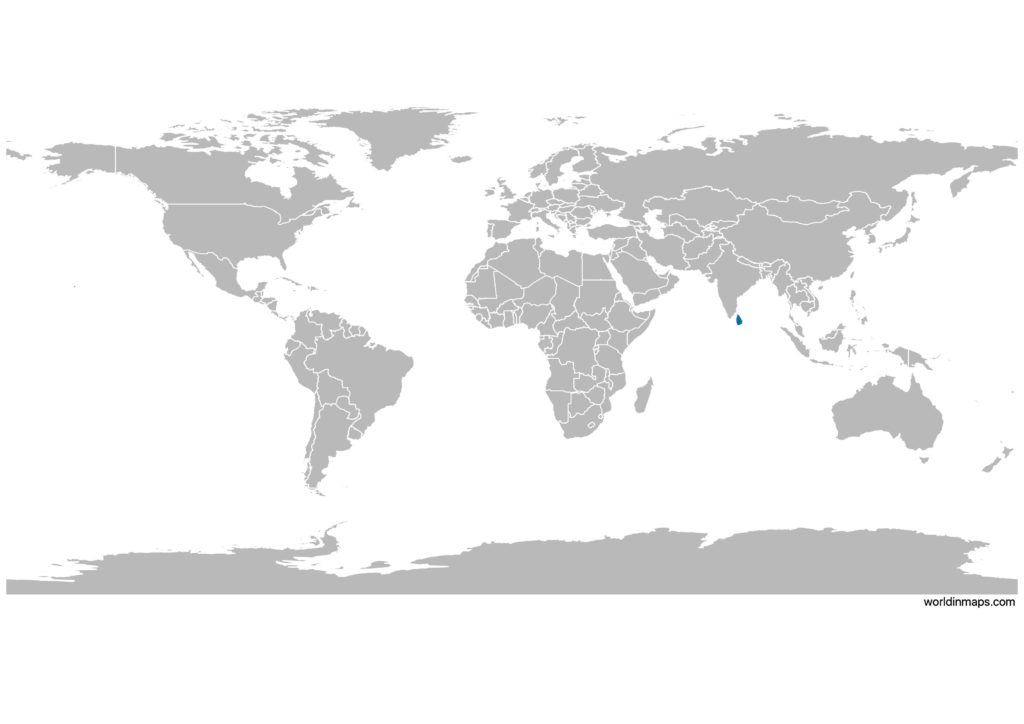
Sri Lanka on the world map
Sri Lanka top 10 largest cities (2012)
- Colombo (561,314)
- Kaduwela (252,041)
- Maharagama (196,423)
- Kesbewa (185,122)
- Dehiwala-Mount Lavinia (184,468)
- Moratuwa (168,280)
- Negombo (142,449)
- Sri Jayawardenepura Kotte (107,925)
- Kalmunai (99,893)
- Kandy (98,828)
Demography
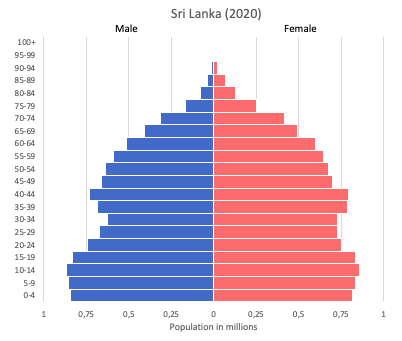
Population pyramid
Age structure data
Estimate for 2020:
- 0-14 years: 23.11% (male 2,696,379/female 2,592,450)
- 15-24 years: 14.58% (male 1,700,442/female 1,636,401)
- 25-54 years: 41.2% (male 4,641,842/female 4,789,101)
- 55-64 years: 10.48% (male 1,110,481/female 1,288,056)
- 65 years and over: 10.63% (male 1,023,315/female 1,410,734)
Remark: the age structure of a population affects a nation’s key socioeconomic issues. Countries with young populations (high percentage under age 15) need to invest more in schools, while countries with older populations (high percentage ages 65 and over) need to invest more in the health sector. The age structure can also be used to help predict potential political issues. For example, the rapid growth of a young adult population unable to find employment can lead to unrest.
Population from 1950 to 2020
Source: United Nations, Department of Economic and Social Affairs, Population Division (2019). World Population Prospects 2019, Online Edition. Rev. 1.
Evolution of the life expectancy from 1960 to 2018
Source: World Development Indicators, The World Bank
Economy
Agriculture:
rice, sugarcane, grains, pulses, oilseed, spices, vegetables, fruit, tea, rubber, coconuts, milk, eggs, hides, beef, fish
Industries:
processing of rubber, tea, coconuts, tobacco and other agricultural commodities, telecommunications, insurance, banking, tourism, shipping, clothing, textiles, cement, petroleum refining, information technology services, construction
Exports – commodities:
textiles and apparel, tea and spices, rubber manufactures, precious stones, coconut products, fish
Imports – commodities:
petroleum, textiles, machinery and transportation equipment, building materials, mineral products, foodstuffs
Time zone and current time in Sri Lanka
Go to our interactive map to get the current time in Sri Lanka