Benin
| Government | |
| Name | Republic of Benin |
| French | République du Bénin |
| Government type | Presidential republic |
| Capital | Porto-Novo (264,320 (2013)) |
| Currency | West African CFA franc (XOF) |
| People | |
| Population (2020) | 12,123,198 (78th) |
| Density of population | 94.8 P/km2 (120th) |
| Nationality | Beninese |
| Official languages | |
| French | |
| Ethnic groups (2013) | |
| Fon and related | 38.4% |
| Adja and related | 15.1% |
| Yoruba and related | 12% |
| Bariba and related | 9.6% |
| Fulani and related | 8.6% |
| Ottamari and related | 6.1% |
| Yoa-Lokpa and related | 4.3% |
| Dendi and related | 2.9% |
| Other | 0.9% |
| Foreigner | 1.9% |
| Religions (2013) | |
| Muslim | 27.7% |
| Roman Catholic | 25.5% |
| Protestant | 13.5% |
| Celestial | 6.7% |
| Methodist | 3.4% |
| Other Protestant | 3.4% |
| Vodoun | 11.6% |
| Other Christian | 9.5% |
| Other traditional religions | 2.6% |
| Other | 2.6% |
| None | 5.8% |
| Life expectancy (2020) | |
| Male | 59.6 years |
| Female | 63.3 years |
| Total population | 61.4 years (212nd) |
| Homicides | |
| Total (2017) | 1.1 per 100,000 people (138th) |
| Geography | |
| Land area | 110,622 km2 |
| water area | 2,000 km2 |
| total area | 112,622 km2 (103rd) |
| Mean elevation | 273 m |
| Lowest point | |
| Atlantic Ocean | 0 m |
| Highest point | |
| Mont Sokbaro | 658 m |
| Land use (2011) | |
| Agricultural land | 31.3% |
| Arable land | 22.9% |
| Permanent crops | 3.5% |
| Permanent pasture | 4.9% |
| Forest | 40% |
| Other | 28.7% |
| Urbanization | |
| Urban population (2020) | 48.4% |
| Rate of urbanization | 3.89% annual rate of change (2015 – 2020) |
| Economy | |
| Labor force (2007) | 3,662 million (98th) |
| Unemployment rate (2014) | 1% (7th) |
| GDP (PPP) (estimate 2019) | |
| Total | $29.918 billion (137th) |
| Per capita | $2,552 (163rd) |
| GDP (nominal) (estimate 2019) | |
| Total | $11.386 billion (141st) |
| Per capita | $971 (163rd) |
| GDP by sector (estimate 2017) | |
| Agriculture | 26.1% |
| Industry | 22.8% |
| Services | 51.1% |
| Exports (2017) | $1.974 billion (140th) |
| Exports partners (2017) | |
| Bangladesh | 18.1% |
| India | 10.7% |
| Ukraine | 9% |
| Niger | 8.1% |
| China | 7.7% |
| Nigeria | 7.2% |
| Turkey | 4% |
| Imports (2017) | $2.787 billion (151st) |
| Imports partners (2017) | |
| Thailand | 18.1% |
| India | 15.9% |
| France | 8.5% |
| China | 7.5% |
| Togo | 5.9% |
| Netherlands | 4.3% |
| Belgium | 4.3% |
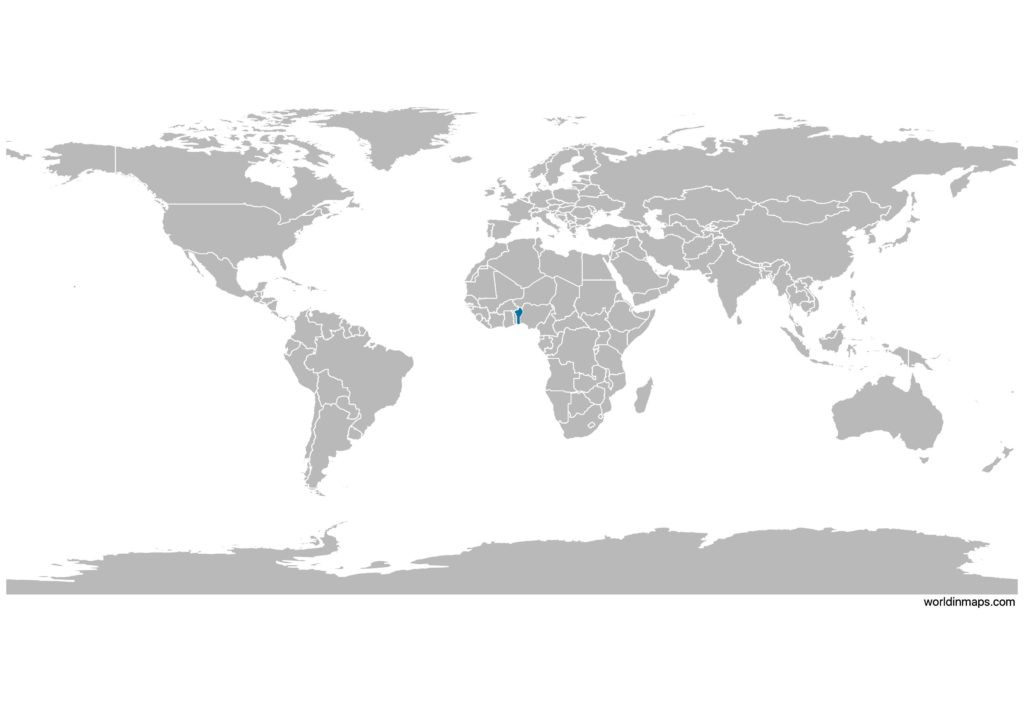
Benin on the world map
Benin top 10 largest cities (2013)
- Cotonou (679,012)
- Porto-Novo (264,320)
- Parakou (255,478)
- Godomey (253,262)
- Abomey-Calavi (117,824)
- Djougou (94,773)
- Bohicon (93,744)
- Ekpè (75,313)
- Abomey (67,885)
- Nikki (66,109)
Demography
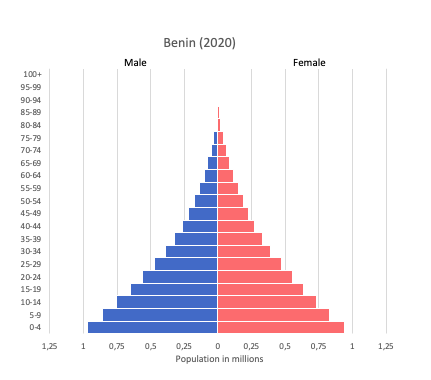
Population pyramid
Age structure data
Estimate for 2020:
- 0-14 years: 45.56% (male 2,955,396/female 2,906,079)
- 15-24 years: 20.36% (male 1,300,453/female 1,318,880)
- 25-54 years: 28.54% (male 1,735,229/female 1,935,839)
- 55-64 years: 3.15% (male 193,548/female 211,427)
- 65 years and over: 2.39% (male 140,513/female 167,270)
Remark: the age structure of a population affects a nation’s key socioeconomic issues. Countries with young populations (high percentage under age 15) need to invest more in schools, while countries with older populations (high percentage ages 65 and over) need to invest more in the health sector. The age structure can also be used to help predict potential political issues. For example, the rapid growth of a young adult population unable to find employment can lead to unrest.
Population from 1950 to 2020
Source: United Nations, Department of Economic and Social Affairs, Population Division (2019). World Population Prospects 2019, Online Edition. Rev. 1.
Evolution of the life expectancy from 1960 to 2018
Source: World Development Indicators, The World Bank
Major rivers
Economy
Agriculture:
cotton, corn, cassava (manioc, tapioca), yams, beans, palm oil, peanuts, cashews, livestock
Industries:
textiles, food processing, construction materials, cement
Exports – commodities:
cotton, cashews, shea butter, textiles, palm products, seafood
Imports – commodities:
foodstuffs, capital goods, petroleum products
Time zone and current time in Benin
Go to our interactive map to get the current time in Benin