Togo
| Government | |
| Name | Togolese Republic |
| French | République togolaise |
| Government type | presidential republic |
| Capital | Lomé (1,477,658 (2010)) |
| Currency | West African CFA franc (XOF) |
| People | |
| Population (2020) | 8,278,737 (100th) |
| Density of population | 125.9 P/km2 (93rd) |
| Nationality | Togolese |
| Official languages | |
| French | |
| Ethnic groups (2013 – 2014) | |
| Adja-Ewe / Mina | 42.4% |
| Kabye / Tem | 25.9% |
| Para-Gourma / Akan | 17.1% |
| Akposso / Akebu | 4.1% |
| Ana-Ife | 3.2% |
| other Togolese | 1.7% |
| foreigners | 5.2% |
| no response | 0.4% |
| note: Togo has an estimated 37 ethnic groups | |
| Religions (2010) | |
| Christian | 43.7% |
| folk | 35.6% |
| Muslim | 14% |
| Hindu | <.1% |
| Buddhist | <.1% |
| Jewish | <.1% |
| other | 0.5% |
| none | 6.2% |
| Life expectancy (2020) | |
| Male | 63.9 years |
| Female | 69.3 years |
| Total population | 66.6 years (185th) |
| Homicides | |
| n.a. | |
| Geography | |
| Land area | 54,385 km2 |
| water area | 2,400 km2 |
| total area | 56,785 km2 (127th) |
| Mean elevation | 236 m |
| Lowest point | |
| Atlantic Ocean | 0 m |
| Highest point | |
| Mont Agou | 986 m |
| Land use (2011) | |
| Agricultural land | 67.4% |
| Arable land | 45.2% |
| Permanent crops | 3.8% |
| Permanent pasture | 18.4% |
| Forest | 4.9% |
| Other | 27.7% |
| Urbanization | |
| Urban population (2020) | 42.8% |
| Rate of urbanization | 3.76% annual rate of change (2015 – 2020) |
| Economy | |
| Labor force (2007) | 2.595 million (114th) |
| Labor force by occupation (1998) | |
| Agriculture | 65% |
| Industry | 5% |
| Services | 30% |
| Unemployment rate (2016) | 6.9% (105th) |
| GDP (PPP) (estimate 2019) | |
| Total | $14.919 billion |
| Per capita | $1,821 |
| GDP (nominal) (estimate 2019) | |
| Total | $5.592 billion |
| Per capita | $682 |
| GDP by sector (estimate 2017) | |
| Agriculture | 28.8% |
| Industry | 21.8% |
| Services | 49.8% |
| Exports (2017) | $1.046 billion (158th) |
| Exports partners (2017) | |
| Benin | 16.7% |
| Burkina Faso | 15.2% |
| Niger | 8.9% |
| India | 7.3% |
| Mali | 6.7% |
| Ghana | 5.5% |
| Côte d’Ivoire | 5.4% |
| Nigeria | 4.1% |
| Imports (2017) | $1.999 billion (167th) |
| Imports partners (2017) | |
| China | 27.5% |
| France | 9.1% |
| Netherlands | 4.4% |
| Japan | 4.3% |
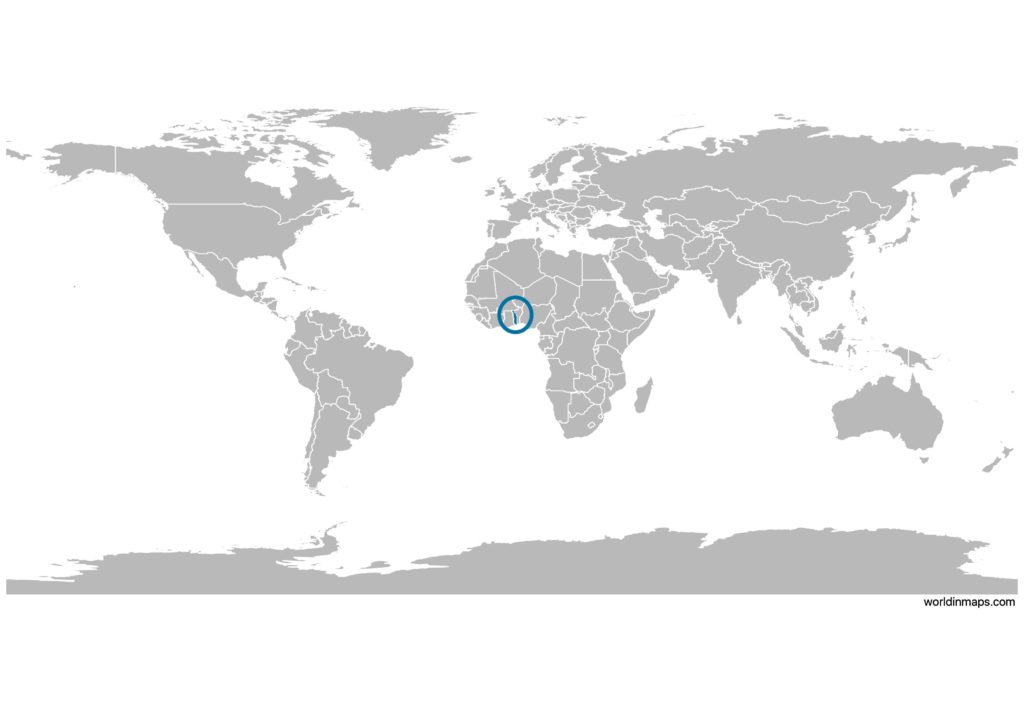
Togo on the world map
Togo top 10 largest cities (2010)
- Lomé (1,477,658)
- Sokodé (95,070)
- Kara (94,878)
- Kpalimé (75,084)
- Atakpamé (69,261)
- Dapaong (58,071)
- Tsévié (54,474)
- Notsé (35,039)
- Aného (24,891)
- Mango (24,766)
Demography
Population pyramid
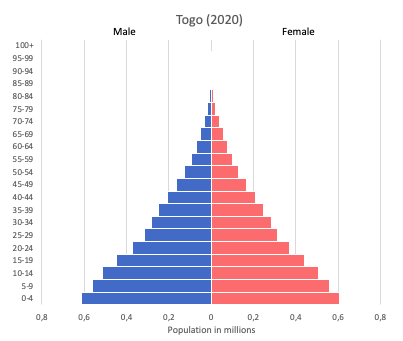
Age structure data
Estimate for 2020:
- 0-14 years: 39.73% (male 1,716,667/female 1,703,230)
- 15-24 years: 19.03% (male 817,093/female 820,971)
- 25-54 years: 33.26% (male 1,423,554/female 1,439,380)
- 55-64 years: 4.42% (male 179,779/female 200,392)
- 65 years and over: 3.57% (male 132,304/female 175,074)
Remark: the age structure of a population affects a nation’s key socioeconomic issues. Countries with young populations (high percentage under age 15) need to invest more in schools, while countries with older populations (high percentage ages 65 and over) need to invest more in the health sector. The age structure can also be used to help predict potential political issues. For example, the rapid growth of a young adult population unable to find employment can lead to unrest.
Population from 1950 to 2020
Source: United Nations, Department of Economic and Social Affairs, Population Division (2019). World Population Prospects 2019, Online Edition. Rev. 1.
Evolution of the life expectancy from 1960 to 2018
Source: World Development Indicators, The World Bank
Economy
Agriculture:
coffee, cocoa, cotton, yams, cassava (manioc, tapioca), corn, beans, rice, millet, sorghum, livestock, fish
Industries:
phosphate mining, agricultural processing, cement, handicrafts, textiles, beverages
Exports – commodities:
reexports, cotton, phosphates, coffee, cocoa
Imports – commodities:
machinery and equipment, foodstuffs, petroleum products
Time zone and current time in Togo
Go to our interactive map to get the current time in Togo