Bolivia
| Government | |
| Name | Plurinational State of Bolivia |
| Spanish | Estado Plurinacional de Bolivia |
| Guarani | Tetã Hetãvoregua Mborivia |
| Aymara | Wuliwya Suyu |
| Quechua | Puliwya Mamallaqta |
| Government type | Presidential republic |
| Constitutional (legislative and juridical) capital | Sucre (259,388 (2012)) |
| Administrative capital | La paz (764,617 (2012)) |
| Currency | Boliviano (BOB) |
| People | |
| Population (2020) | 11,673,029 (82nd) |
| Density of population | 10.4 P/km2 (224th) |
| Nationality | Bolivian |
| Official languages | |
| Spanish | |
| Quechua | |
| Aymara | |
| Guarani | |
| Ethnic groups (2018) | |
| Mestizo | 68% |
| Indigenous | 20% |
| White | 5% |
| Black | 1% |
| Other | 4% |
| Unspecified | 2% |
| Religions (2012) | |
| Roman Catholic | 76.8% |
| Evangelic and Pentecostal | 8.1% |
| Protestant | 7.9% |
| Other | 1.7% |
| None | 5.5% |
| Life expectancy (2020) | |
| Male | 67.6 years |
| Female | 73.4 years |
| Total population | 70.4 years (165th) |
| Homicides | |
| Total (2016) | 6.2 per 100,000 people (52nd) |
| Geography | |
| Land area | 1,083,301 km2 |
| water area | 15,280 km2 |
| total area | 1,098,581 km2 (29th) |
| Mean elevation | 1,192 m |
| Lowest point | |
| Rio Paraguay | 90 m |
| Highest point | |
| Nevado Sajama | 6,542 m |
| Land use (2011) | |
| Agricultural land | 34.3% |
| Arable land | 3.6% |
| Permanent crops | 0.2% |
| Permanent pasture | 30.5% |
| Forest | 52.5% |
| Other | 13.2% |
| Urbanization | |
| Urban population (2020) | 70.1 |
| Rate of urbanization | 1.97% annual rate of change (2015 – 2020) |
| Economy | |
| Labor force (2016) | 5.719 million (73th) |
| Labor force by occupation (2015) | |
| Agriculture | 29.4% |
| Industry | 22% |
| Services | 48.6% |
| Unemployment rate (2017) | 4% (49th) |
| GDP (PPP) (estimate 2019) | |
| Total | $89.018 billion |
| Per capita | $7,790 |
| GDP (nominal) (estimate 2019) | |
| Total | $43.687 billion |
| Per capita | $3,823 |
| GDP by sector (estimate 2017) | |
| Agriculture | 13.8% |
| Industry | 37.8% |
| Services | 48.2% |
| Exports (2017) | $7.746 billion (97th) |
| Exports partners (2017) | |
| Brazil | 17.9% |
| Argentina | 16% |
| US | 7.8% |
| Japan | 7.3% |
| India | 6.6% |
| South Korea | 6.3% |
| Colombia | 5.8% |
| China | 5.1% |
| UAE | 4.7% |
| Imports (2017) | $8.601 billion (107th) |
| Imports partners (2017) | |
| China | 21.7% |
| Brazil | 16.8% |
| Argentina | 12.6% |
| US | 8.4% |
| Peru | 6.5% |
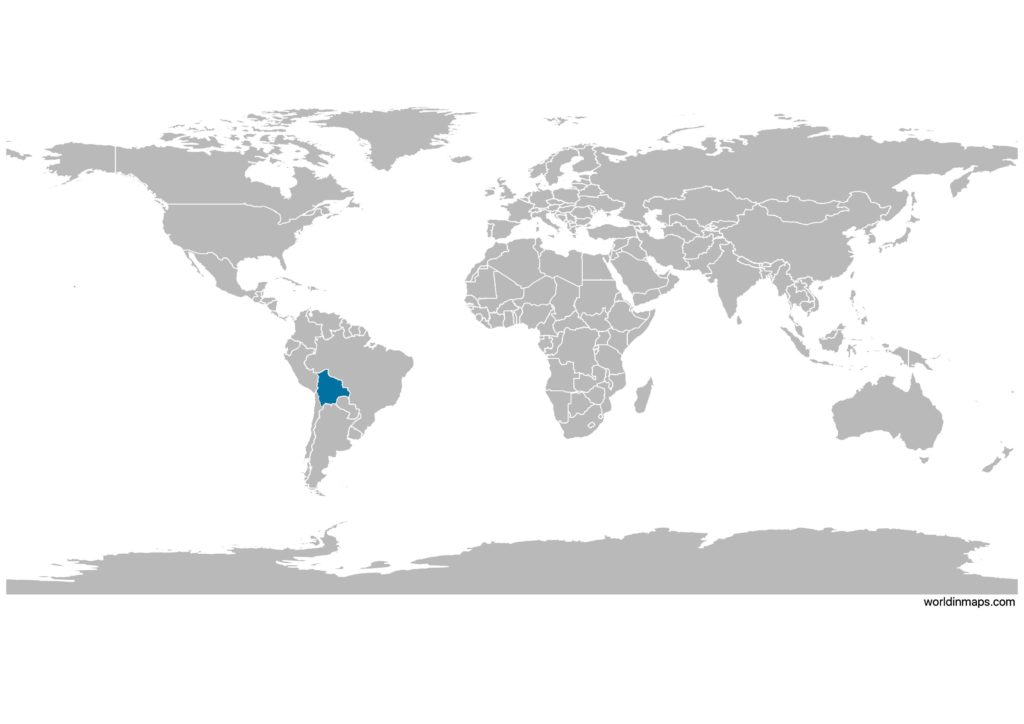
Bolivia on the world map
Bolivia top 10 largest cities (2018)
- Santa Cruz de la Sierra (1,453,549)
- El Alto (848,840)
- La Paz (764,617)
- Cochabamba (630,587)
- Oruro (264,683)
- Sucre (259,388)
- Tarija (205,346)
- Potosi (189,652)
- Sacaba (169,494)
- Quillacollo (137,029)
Demography
Population pyramid
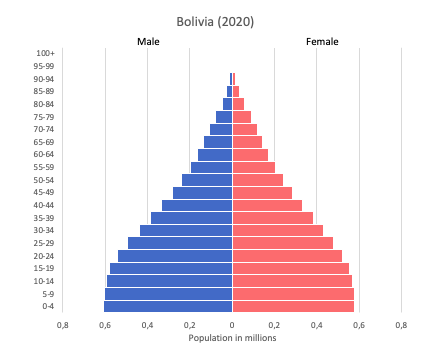
Age structure data
Estimate for 2020:
- 0-14 years: 30.34% (male 1,799,925/female 1,731,565)
- 15-24 years: 19.21% (male 1,133,120/female 1,103,063)
- 25-54 years: 38.68% (male 2,212,096/female 2,289,888)
- 55-64 years: 6.06% (male 323,210/female 382,139)
- 65 years and over: 5.71% (male 291,368/female 373,535)
Remark: the age structure of a population affects a nation’s key socioeconomic issues. Countries with young populations (high percentage under age 15) need to invest more in schools, while countries with older populations (high percentage ages 65 and over) need to invest more in the health sector. The age structure can also be used to help predict potential political issues. For example, the rapid growth of a young adult population unable to find employment can lead to unrest.
Population from 1950 to 2020
Source: United Nations, Department of Economic and Social Affairs, Population Division (2019). World Population Prospects 2019, Online Edition. Rev. 1.
Evolution of the life expectancy from 1960 to 2018
Source: World Development Indicators, The World Bank
Economy
Agriculture:
soybeans, quinoa, Brazil nuts, sugarcane, coffee, corn, rice, potatoes, chia, coca
Industries:
mining, smelting, electricity, petroleum, food and beverages, handicrafts, clothing, jewelry
Exports – commodities:
natural gas, silver, zinc, lead, tin, gold, quinoa, soybeans and soy products
Imports – commodities:
machinery, petroleum products, vehicles, iron and steel, plastics
Time zone and current time in Bolivia
Go to our interactive map to get the current time in Bolivia