Brunei
| Government | |
| Name | Brunei Darussalam |
| Rumi | Negara Brunei Darussalam |
| Jawi | نڬارا بروني دارالسلام |
| Government type | Absolute monarchy or sultanate |
| Capital | Bandar Seri Begawan (100,700 (2007)) |
| Currency | Brunei dollar (BND) |
| Organization | |
| Member State | Commonwealth of Nations |
| People | |
| Population (2020) | 437,483 (175th) |
| Density of population | 72.11 P/km2 (134th) |
| Nationality | Bruneian |
| Official languages | |
| Malay (Bahasa Melayu) | |
| Ethnic groups (2016) | |
| Malay | 65.7% |
| Chinese | 10.3% |
| Other | 24% |
| Religions (2011) | |
| Muslim (official) | 78.8% |
| Christian | 8.7% |
| Buddhist | 7.8% |
| Other | 4.7% |
| Life expectancy (2020) | |
| Male | 75.5 years |
| Female | 80.4 years |
| Total population | 77.9 years (70th) |
| Homicides | |
| Total (2013) | 0.5 per 100,000 people (162nd) |
| Geography | |
| Land area | 5,265 km2 |
| water area | 500 km2 |
| total area | 5,765 km2 (141st) |
| Mean elevation | 478 m |
| Lowest point | |
| South China Sea | 0 m |
| Highest point | |
| Bukit Pagon | 1,850 m |
| Land use (2011) | |
| Agricultural land | 2.5% |
| Arable land | 0.8% |
| Permanent crops | 1.1% |
| Permanent pasture | 0.6% |
| Forest | 71.8% |
| Other | 25.7% |
| Urbanization | |
| Urban population (2020) | 78.3% |
| Rate of urbanization | 1.66% annual rate of change (2015 – 2020) |
| Economy | |
| Labor force (2014) | 203,600 (170th) |
| Labor force by occupation (2008) | |
| Agriculture | 4.2% |
| Industry | 62.8% |
| Services | 33% |
| Unemployment rate (2017) | 6.9% (102nd) |
| GDP (PPP) (estimate 2019) | |
| Total | $36.854 billion (125th) |
| Per capita | $85,011(5th) |
| GDP (nominal) (estimate 2019) | |
| Total | $13.325 billion (124th) |
| Per capita | $30,290 (29th) |
| GDP by sector (estimate 2017) | |
| Agriculture | 1.2% |
| Industry | 56.6% |
| Services | 42.3% |
| Exports (2017) | $5.885 billion (103rd) |
| Exports partners (2017) | |
| Japan | 27.8% |
| South Korea | 12.4% |
| Thailand | 11.5% |
| Malaysia | 11.3% |
| India | 9.3% |
| Singapore | 7.7% |
| Switzerland | 5% |
| China | 4.7% |
| Imports (2017) | $2.998 billion (147th) |
| Imports partners (2017) | |
| China | 19.6% |
| Singapore | 19% |
| Malaysia | 18.8% |
| US | 9.2% |
| Germany | 5.9% |
| Japan | 4.1% |
| UK | 4% |
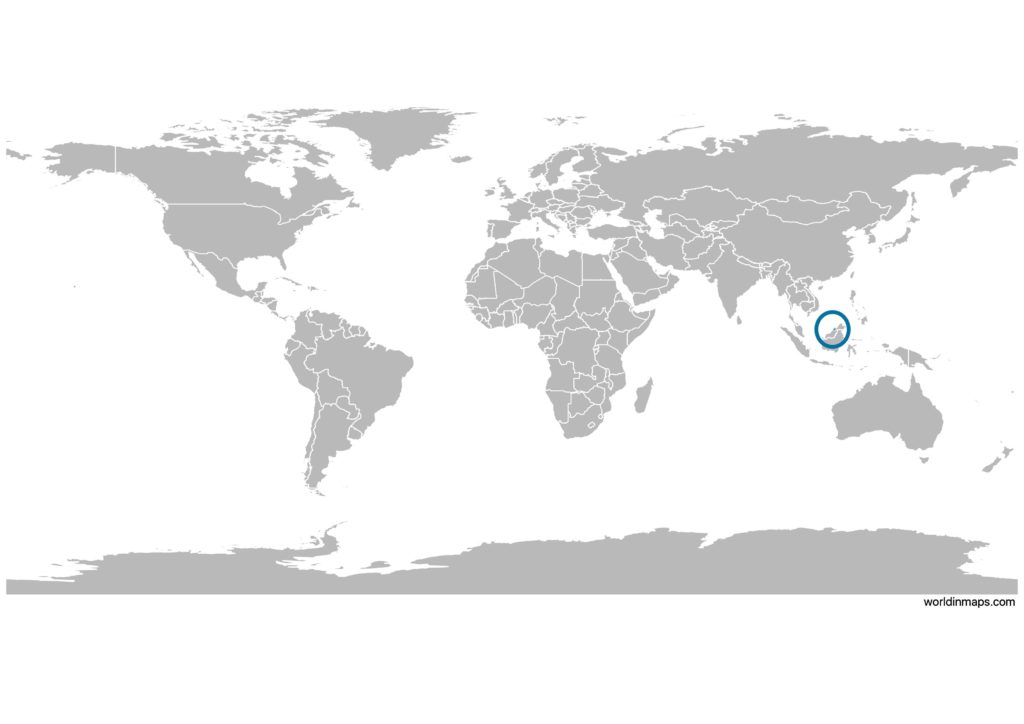
Brunei on the world map
Demography
Population pyramid
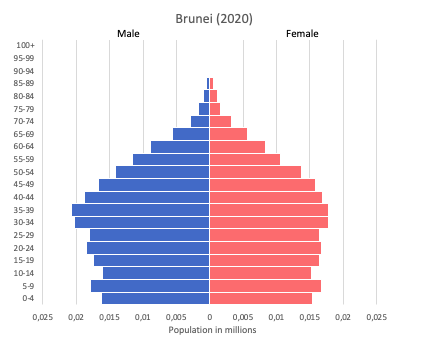
Age structure data
Estimate for 2020:
- 0-14 years: 22.41% (male 53,653/female 50,446)
- 15-24 years: 16.14% (male 37,394/female 37,559)
- 25-54 years: 47.21% (male 103,991/female 115,291)
- 55-64 years: 8.34% (male 19,159/female 19,585)
- 65 years and over: 5.9% (male 13,333/female 14,067)
Remark: the age structure of a population affects a nation’s key socioeconomic issues. Countries with young populations (high percentage under age 15) need to invest more in schools, while countries with older populations (high percentage ages 65 and over) need to invest more in the health sector. The age structure can also be used to help predict potential political issues. For example, the rapid growth of a young adult population unable to find employment can lead to unrest.
Population from 1950 to 2020
Source: United Nations, Department of Economic and Social Affairs, Population Division (2019). World Population Prospects 2019, Online Edition. Rev. 1.
Evolution of the life expectancy from 1960 to 2018
Source: World Development Indicators, The World Bank
Economy
Agriculture:
rice, vegetables, fruits; chickens, water buffalo, cattle, goats, eggs
Industries:
petroleum, petroleum refining, liquefied natural gas, construction, agriculture, aquaculture, transportation
Exports – commodities:
mineral fuels, organic chemicals
Imports – commodities:
machinery and mechanical appliance parts, mineral fuels, motor vehicles, electric machinery
Time zone and current time in Brunei
Go to our interactive map to get the current time in Brunei