Ghana
| Government | |
| Name | Republic of Ghana |
| Government type | Presidential republic |
| Capital | Accra (2,291,352 (2013)) |
| Currency | Ghanaian cedi (GHS) |
| Organization | |
| Member State | Commonwealth of Nations |
| People | |
| Population (2020) | 31,072,945 (47th) |
| Density of population | 101.5 P/km2 (103rd) |
| Nationality | Ghanaian |
| Official languages | |
| English | |
| Ethnic groups (2010) | |
| Akan | 47.5% |
| Mole-Dagbon | 16.6% |
| Ewe | 13.9% |
| Ga-Dangme | 7.4% |
| Gurma | 5.7% |
| Guan | 3.7% |
| Grusi | 2.5% |
| Mande | 1.1% |
| Other | 1.4% |
| Religions (2010) | |
| Christian | 71.2% |
| Pentecostal/Charismatic | 28.3% |
| Protestant | 18.4% |
| Catholic | 13.1% |
| Other | 11.4% |
| Muslim | 17.6% |
| Traditional | 5.2% |
| Other | 0.8% |
| None | 5.2% |
| Life expectancy (2020) | |
| Male | 65.6 years |
| Female | 70.8 years |
| Total population | 68.2 years (176th) |
| Homicides | |
| Total (2017) | 2.1 per 100,000 people (107th) |
| Geography | |
| Land area | 227,533 km2 |
| water area | 11,000 km2 |
| total area | 238,533 km2 (83th) |
| Mean elevation | 190 m |
| Lowest point | |
| Atlantic Ocean | 0 m |
| Highest point | |
| Mount Afadjato | 885 m |
| Land use (2011) | |
| Agricultural land | 69.1% |
| Arable land | 20.7% |
| Permanent crops | 11.9% |
| Permanent pasture | 36.5% |
| Forest | 21.2% |
| Other | 9.7% |
| Urbanization | |
| Urban population (2020) | 57.3% |
| Rate of urbanization | 3.34% annual rate of change (2015 – 2020) |
| Economy | |
| Labor force (2017) | 12.49 million (47th) |
| Labor force by occupation (2013) | |
| Agriculture | 44.7% |
| Industry | 14.4% |
| Services | 40.9% |
| Unemployment rate (2015) | 11.9% (158th) |
| GDP (PPP) (estimate 2020) | |
| Total | $226 billion |
| Per capita | $7,343 |
| GDP (nominal) (estimate 2020) | |
| Total | $69.757 billion |
| Per capita | $2,266 |
| GDP by sector (estimate 2017) | |
| Agriculture | 18.3% |
| Industry | 24.5% |
| Services | 57.2% |
| Exports (2017) | $13.84 billion (77th) |
| Exports partners (2017) | |
| India | 23.8% |
| UAE | 13.4% |
| China | 10.8% |
| Switzerland | 10.1% |
| Vietnam | 5.2% |
| Burkina Faso | 4% |
| Imports (2017) | $12.65 billion (92nd) |
| Imports partners (2017) | |
| China | 16.8% |
| US | 8% |
| UK | 6.2% |
| Belgium | 5.9% |
| India | 4.1% |
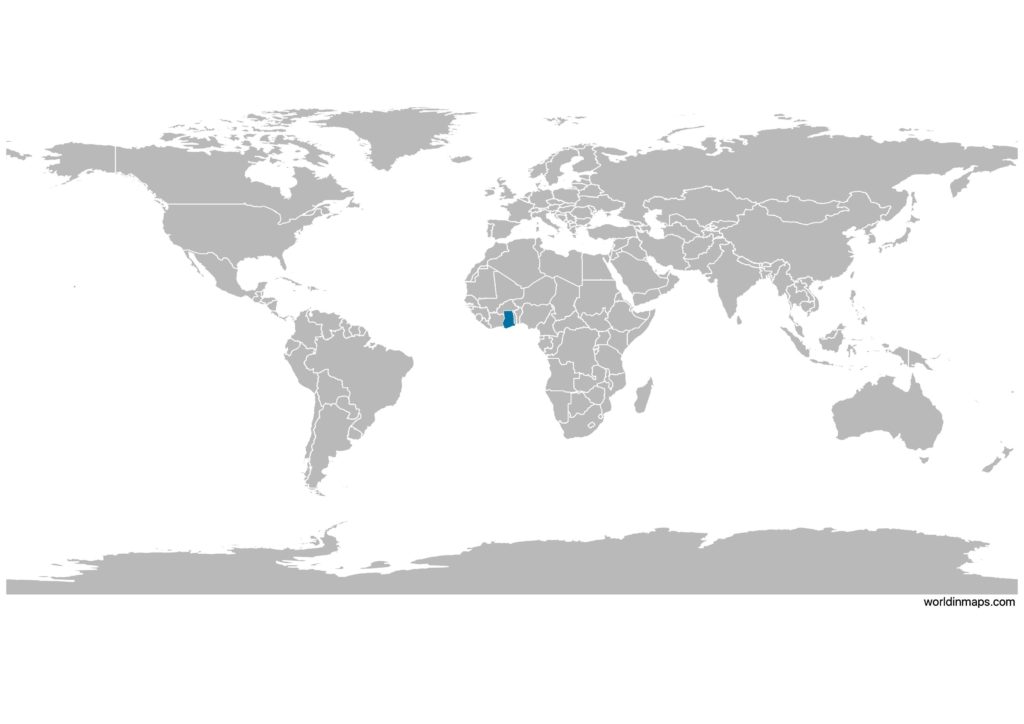
Ghana on the world map
Ghana top 10 largest cities (2013)
- Accra (2,291,352)
- Kumasi (2,069,350)
- Tamale (562,919)
- Sekondi-Takoradi (539,548)
- Ashaiman (298,841)
- Sunyani (248,496)
- Cape Coast (227,269)
- Obuasi (180,334)
- Teshie (176,597)
- Tema (161,612)
Demography
Population pyramid
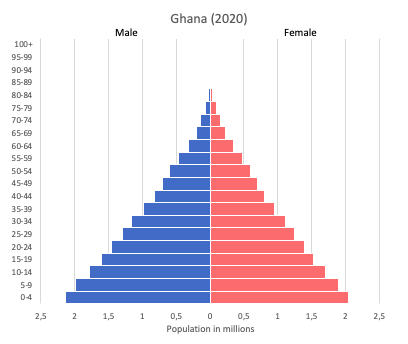
Age structure data
Estimate for 2020:
- 0-14 years: 37.44% (male 5,524,932/female 5,460,943)
- 15-24 years: 18.64% (male 2,717,481/female 2,752,601)
- 25-54 years: 34.27% (male 4,875,985/female 5,177,959)
- 55-64 years: 5.21% (male 743,757/female 784,517)
- 65 years and over: 4.44% (male 598,387/female 703,686)
Remark: the age structure of a population affects a nation’s key socioeconomic issues. Countries with young populations (high percentage under age 15) need to invest more in schools, while countries with older populations (high percentage ages 65 and over) need to invest more in the health sector. The age structure can also be used to help predict potential political issues. For example, the rapid growth of a young adult population unable to find employment can lead to unrest.
Population from 1950 to 2020
Source: United Nations, Department of Economic and Social Affairs, Population Division (2019). World Population Prospects 2019, Online Edition. Rev. 1.
Evolution of the life expectancy from 1960 to 2018
Source: World Development Indicators, The World Bank
Economy
Agriculture:
cocoa, rice, cassava (manioc, tapioca), peanuts, corn, shea nuts, bananas, timber
Industries:
mining, lumbering, light manufacturing, aluminum smelting, food processing, cement, small commercial ship building, petroleum
Exports – commodities:
oil, gold, cocoa, timber, tuna, bauxite, aluminum, manganese ore, diamonds, horticultural products
Imports – commodities:
capital equipment, refined petroleum, foodstuffs
Time zone and current time in Ghana
Go to our interactive map to get the current time in Ghana