Central African Republic
| Government | |
| Name | Central African Republic |
| French | République centrafricaine |
| Sango | Ködörösêse tî Bêafrîka |
| Government type | Presidential republic |
| Capital | Bangui (622,771 (2003)) |
| Currency | Central African CFA (XAF) |
| People | |
| Population (2020) | 4,829,764 (118th) |
| Density of population | 7.1 P/km2 (221st) |
| Nationality | Central African |
| Official languages | |
| French | |
| Sangho | |
| Ethnic groups | |
| Baya | 33% |
| Banda | 27% |
| Mandjia | 13% |
| Sara | 10% |
| Mboum | 7% |
| M’Baka | 4% |
| Yakoma | 4% |
| Other | 2% |
| Religions (2010) | |
| Christian | 89.5% |
| Muslim | 8.5% |
| Folk | 1% |
| Unaffiliated | 1% |
| Life expectancy (2020) | |
| Male | 52.7 years |
| Female | 55.7 years |
| Total population | 54.2 years (224th) |
| Homicides | |
| Total (2016) | 20.1 per 100,000 people (20th) |
| Geography | |
| Land area | 622,984 km2 |
| water area | 0 km2 |
| total area | 622,984 km2 (46st) |
| Mean elevation | 635 m |
| Lowest point | |
| Oubangui River | 335 m |
| Highest point | |
| Mont Ngaoui | 1,410 m |
| Land use (2011) | |
| Agricultural land | 8.1% |
| Arable land | 2.9% |
| Permanent crops | 0.1% |
| Permanent pasture | 5.1% |
| Forest | 36.2% |
| Other | 55.7% |
| Urbanization | |
| Urban population (2020) | 42.2% |
| Rate of urbanization | 2.52% annual rate of change (2015 – 2020) |
| Economy | |
| Labor force (2017) | 2.242 million (120th) |
| Unemployment rate (2017) | 6.9% (103rd) |
| GDP (PPP) (estimate 2017) | |
| Total | $3.454 billion |
| Per capita | $693 |
| GDP (nominal) (estimate 2017) | |
| Total | $2.003 billion |
| Per capita | $401 |
| GDP by sector (estimate 2017) | |
| Agriculture | 43.2% |
| Industry | 16% |
| Services | 40.8% |
| Exports (2017) | $113.7 million (196th) |
| Exports partners (2017) | |
| France | 31.2% |
| Burundi | 16.2% |
| China | 12.5% |
| Cameroon | 9.6% |
| Austria | 7.8% |
| Imports (2017) | $393.1 million (200th) |
| Imports partners (2017) | |
| France | 17.1% |
| US | 12.3% |
| India | 11.5% |
| China | 8.2% |
| South Africa | 7.4% |
| Japan | 5.8% |
| Italy | 5.1% |
| Cameroon | 4.9% |
| Netherlands | 4.6% |
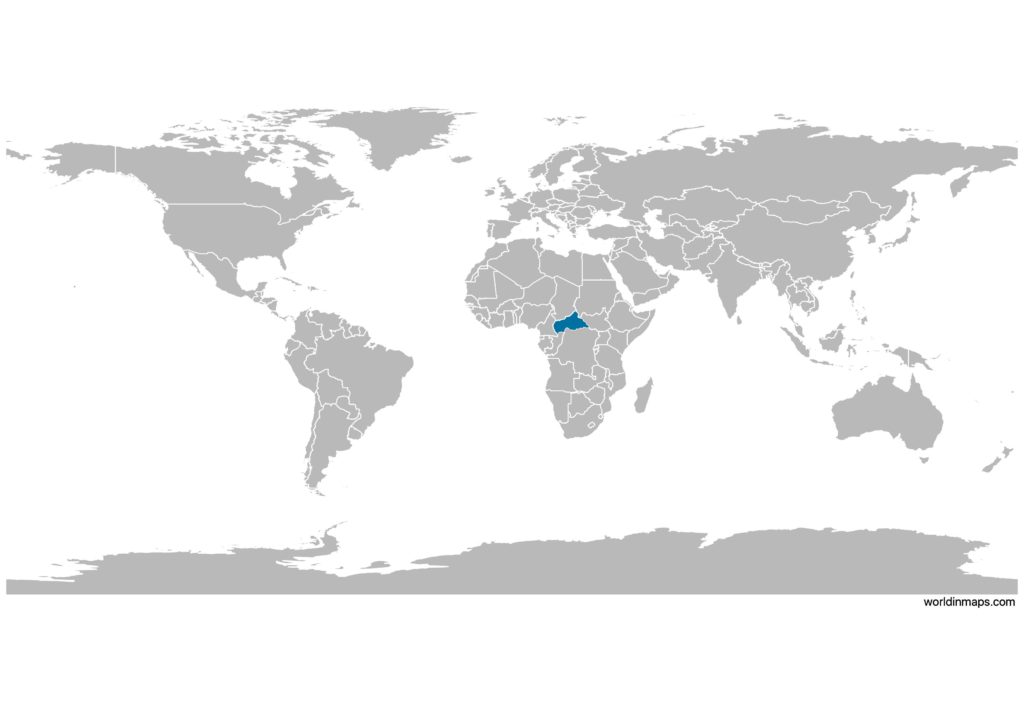
Central African Republic on the world map
Central African Republic top 10 largest cities (2003)
- Bangui (622,771)
- Bimbo (124,176)
- Berbérati (76,918)
- Carnot (45,421)
- Bambari (41,356)
- Bouar (40,353)
- Bossangoa (36,478)
- Bria (35,204)
- Bangassou (31,553)
- Nola (29,181)
Demography
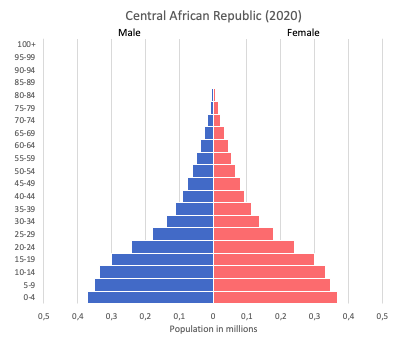
Population pyramid
Age structure data
Estimate for 2020:
- 0-14 years: 39.49% (male 1,188,682/female 1,176,958)
- 15-24 years: 19.89% (male 598,567/female 593,075)
- 25-54 years: 32.95% (male 988,077/female 986,019)
- 55-64 years: 4.32% (male 123,895/female 134,829)
- 65 years and over: 3.35% (male 78,017/female 122,736)
Remark: the age structure of a population affects a nation’s key socioeconomic issues. Countries with young populations (high percentage under age 15) need to invest more in schools, while countries with older populations (high percentage ages 65 and over) need to invest more in the health sector. The age structure can also be used to help predict potential political issues. For example, the rapid growth of a young adult population unable to find employment can lead to unrest.
Population from 1950 to 2020
Source: United Nations, Department of Economic and Social Affairs, Population Division (2019). World Population Prospects 2019, Online Edition. Rev. 1.
Evolution of the life expectancy from 1960 to 2018
Source: World Development Indicators, The World Bank
Economy
Agriculture:
cotton, coffee, tobacco, cassava (manioc, tapioca), yams, millet, corn, bananas, timber
Industries:
gold and diamond mining, logging, brewing, sugar refining
Exports – commodities:
diamonds, timber, cotton, coffee
Imports – commodities:
food, textiles, petroleum products, machinery, electrical equipment, motor vehicles, chemicals, pharmaceuticals
Time zone and current time in Central African Republic
Go to our interactive map to get the current time in Central African Republic