Uganda
| Government | |
| Name | Republic of Uganda |
| Swahili | Jamhuri ya Uganda |
| Government type | presidential republic |
| Capital | Kampala (1,507,114 (2016)) |
| Currency | Ugandan shilling (UGX) |
| Organization | |
| Member State | Commonwealth of Nations |
| People | |
| Population (2020) | 45,741,000 (35th) |
| Density of population | 157.1 P/km2 |
| Nationality | Ugandan |
| Official languages | |
| English | |
| Swahili | |
| Ethnic groups (2014) | |
| Baganda | 16.5% |
| Banyankole | 9.6% |
| Basoga | 8.8% |
| Bakiga | 7.1% |
| Iteso | 7% |
| Langi | 6.3% |
| Bagisu | 4.9% |
| Acholi | 4.4% |
| Lugbara | 3.3% |
| other | 32.1% |
| Religions (2014) | |
| Protestant | 45.1% |
| Anglican | 32.0% |
| Pentecostal / Born Again / Evangelical | 11.1% |
| Seventh Day Adventist | 1.7% |
| Baptist | 0.3% |
| Roman Catholic | 39.3% |
| Muslim | 13.7% |
| other | 1.6% |
| none | 0.2% |
| Life expectancy (2020) | |
| Male | 66 years |
| Female | 70.5 years |
| Total population | 68.2 years (177th) |
| Homicides | |
| Total (2018) | 10.5 per 100,000 people (33rd) |
| Geography | |
| Land area | 197,100 km2 |
| water area | 43,938 km2 |
| total area | 241,038 km2 (82nd) |
| Lowest point | |
| Albert Nile | 614 m |
| Highest point | |
| Margherita Peak on Mount Stanley | 5,110 m |
| Land use (2011) | |
| Agricultural land | 71.2% |
| Arable land | 34.3% |
| Permanent crops | 11.3% |
| Permanent pasture | 25.6% |
| Forest | 14.5% |
| Other | 14.3% |
| Urbanization | |
| Urban population (2020) | 25% |
| Rate of urbanization | 5.7% annual rate of change (2015 – 2020) |
| Economy | |
| Labor force (2015) | 15.84 million (38th) |
| Labor force by occupation (2013) | |
| Agriculture | 71% |
| Industry | 7% |
| Services | 22% |
| Unemployment rate (2014) | 9.4% (137th) |
| GDP (PPP) (estimate 2019) | |
| Total | $102.659 billion |
| Per capita | $2,566 |
| GDP (nominal) (estimate 2019) | |
| Total | $30.765 billion |
| Per capita | $769 |
| GDP by sector (estimate 2017) | |
| Agriculture | 28.2% |
| Industry | 21.1% |
| Services | 50.7% |
| Exports (2017) | $3.339 billion (124th) |
| Exports partners (2017) | |
| Kenya | 17.7% |
| UAE | 16.7% |
| Democratic Republic of the Congo | 6.6% |
| Rwanda | 6.1% |
| Italy | 4.8% |
| Imports (2017) | $5.036 billion (127th) |
| Imports partners (2017) | |
| China | 17.4% |
| India | 13.4% |
| UAE | 12.2% |
| Kenya | 7.9% |
| Japan | 6.4% |
| Saudi Arabia | 6.3% |
| Indonesia | 4.4% |
| South Africa | 4.1% |
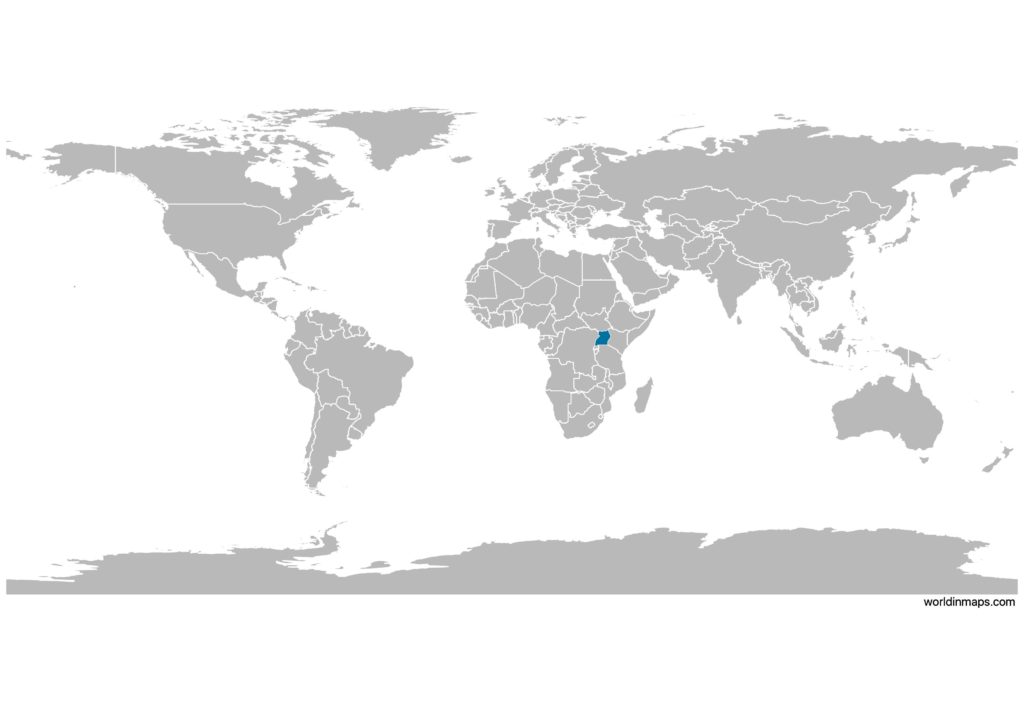
Uganda on the world map
Uganda top 10 largest cities (2016)
- Kampala (1,507,114)
- Nansana (365,857)
- Kira (317,428)
- Makindye-Ssabagabo (282,664)
- Mbarara (195,160)
- Mukono (162,744)
- Gulu (149,802)
- Lugazi (114,163)
- Kasese (103,293)
- Masaka (101,557)
Demography
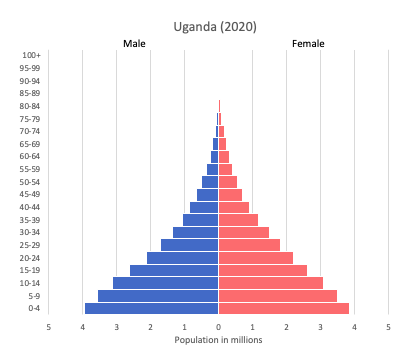
Population pyramid
Age structure data
Estimate for 2020:
- 0-14 years: 48.21% (male 10,548,913/female 10,304,876)
- 15-24 years: 20.25% (male 4,236,231/female 4,521,698)
- 25-54 years: 26.24% (male 5,202,570/female 6,147,304)
- 55-64 years: 2.91% (male 579,110/female 681,052)
- 65 years and over: 2.38% (male 442,159/female 589,053)
Remark: the age structure of a population affects a nation’s key socioeconomic issues. Countries with young populations (high percentage under age 15) need to invest more in schools, while countries with older populations (high percentage ages 65 and over) need to invest more in the health sector. The age structure can also be used to help predict potential political issues. For example, the rapid growth of a young adult population unable to find employment can lead to unrest.
Population from 1950 to 2020
Source: United Nations, Department of Economic and Social Affairs, Population Division (2019). World Population Prospects 2019, Online Edition. Rev. 1.
Evolution of the life expectancy from 1960 to 2018
Source: World Development Indicators, The World Bank
Economy
Agriculture:
coffee, tea, cotton, tobacco, cassava (manioc, tapioca), potatoes, corn, millet, pulses, cut flowers; beef, goat meat, milk, poultry, and fish
Industries:
sugar processing, brewing, tobacco, cotton textiles; cement, steel production
Exports – commodities:
coffee, fish and fish products, tea, cotton, flowers, horticultural products; gold
Imports – commodities:
capital equipment, vehicles, petroleum, medical supplies; cereals
Time zone and current time in Uganda
Go to our interactive map to get the current time in Uganda