Rwanda
| Government | |
| Name | Republic of Rwanda |
| Kinyarwanda | Repubulika y’u Rwanda |
| French | République du Rwanda |
| Swahili | Jamhuri ya Rwanda |
| Government type | presidential republic |
| Capital | Kigali (745,261 (2005)) |
| Currency | Rwandan franc (RWF) |
| Organization | |
| Member State | Commonwealth of Nations |
| People | |
| Population (2020) | 12,952,209 (76th) |
| Density of population | 470 P/km2 (22nd) |
| Nationality | Rwandan |
| Official languages | |
| Kinyarwanda | |
| French | |
| English | |
| Swahili | |
| Ethnic groups | |
| Hutu | |
| Tutsi | |
| Twa (Pygmy) | |
| Religions (2012) | |
| Protestant | 49.5% |
| Adventist | 11.8% |
| other Protestant | 37.7% |
| Roman Catholic | 43.7% |
| Muslim | 2% |
| other | 0.9% |
| none | 2.5% |
| unspecified | 1.3% |
| Life expectancy (2020) | |
| Male | 63.2 years |
| Female | 67.1 years |
| Total population | 65.1 years (196th) |
| Homicides | |
| Total (2015) | 2.6 per 100,000 people (88th) |
| Geography | |
| Land area | 24,668 km2 |
| water area | 1,670 km2 |
| total area | 26,338 km2 (149th) |
| Mean elevation | 1,598 m |
| Lowest point | |
| Rusizi River | 950 m |
| Highest point | |
| Karisimbi volcano | 4,519 m |
| Land use (2011) | |
| Agricultural land | 74.5% |
| Arable land | 47% |
| Permanent crops | 10.1% |
| Permanent pasture | 17.4% |
| Forest | 18% |
| Other | 7.5% |
| Urbanization | |
| Urban population (2020) | 17.4% |
| Rate of urbanization | 2.86% annual rate of change (2015 – 2020) |
| Economy | |
| Labor force (2017) | 6.227 million (72nd) |
| Labor force by occupation (2012) | |
| Agriculture | 75.3% |
| Industry | 6.7% |
| Services | 18% |
| Unemployment rate (2014) | 2.7% (29th) |
| GDP (PPP) (estimate 2019) | |
| Total | $30.068 billion |
| Per capita | $2,444 |
| GDP (nominal) (estimate 2019) | |
| Total | $10.211 billion |
| Per capita | $830 |
| GDP by sector (estimate 2017) | |
| Agriculture | 30.9% |
| Industry | 17.6% |
| Services | 51.5% |
| Exports (2017) | $1.05 billion (157th) |
| Exports partners (2017) | |
| UAE | 38.3% |
| Kenya | 15.1% |
| Switzerland | 9.9% |
| Democratic Republic of the Congo | 9.5% |
| US | 4.9% |
| Singapore | 4.5% |
| Imports (2017) | $1.922 billion (168th) |
| Imports partners (2017) | |
| China | 20.4% |
| Uganda | 11% |
| India | 7.2% |
| Kenya | 7.1% |
| Tanzania | 5.3% |
| UAE | 5.1% |
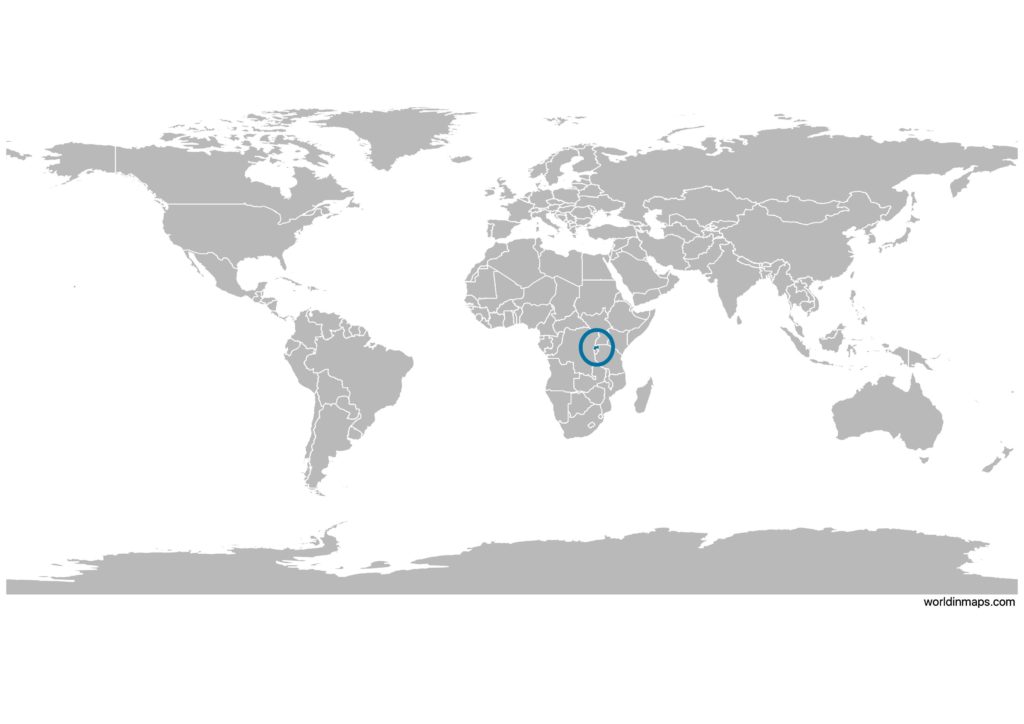
Rwanda on the world map
Rwanda top 10 largest cities (2005)
- Kigali (745,261)
- Butare (89,600)
- Muhanga (87,613)
- Ruhengeri (86,685)
- Gisenyi (83,623)
- Byumba (70,593)
- Cyangugu (63,883)
- Nyanza (56,679)
- Kabuga (54,246)
- Ruhango (54,104)
Demography
Population pyramid
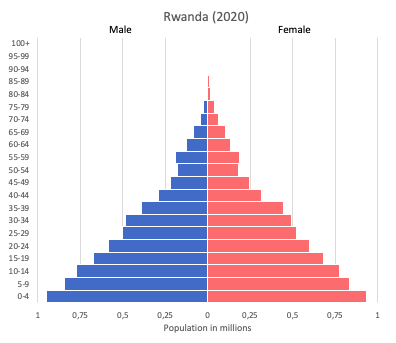
Age structure data
Estimate for 2020:
- 0-14 years: 39.95% (male 2,564,893/female 2,513,993)
- 15-24 years: 20.1% (male 1,280,948/female 1,273,853)
- 25-54 years: 33.06% (male 2,001,629/female 2,201,132)
- 55-64 years: 4.24% (male 241,462/female 298,163)
- 65 years and over: 2.65% (male 134,648/female 201,710)
Remark: the age structure of a population affects a nation’s key socioeconomic issues. Countries with young populations (high percentage under age 15) need to invest more in schools, while countries with older populations (high percentage ages 65 and over) need to invest more in the health sector. The age structure can also be used to help predict potential political issues. For example, the rapid growth of a young adult population unable to find employment can lead to unrest.
Population from 1950 to 2020
Source: United Nations, Department of Economic and Social Affairs, Population Division (2019). World Population Prospects 2019, Online Edition. Rev. 1.
Evolution of the life expectancy from 1960 to 2018
Source: World Development Indicators, The World Bank
Economy
Agriculture:
coffee, tea, pyrethrum (insecticide made from chrysanthemums), bananas, beans, sorghum, potatoes; livestock
Industries:
cement, agricultural products, small-scale beverages, soap, furniture, shoes, plastic goods, textiles, cigarettes
Exports – commodities:
coffee, tea, hides, tin ore
Imports – commodities:
foodstuffs, machinery and equipment, steel, petroleum products, cement and construction material
Time zone and current time in Rwanda
Go to our interactive map to get the current time in Rwanda